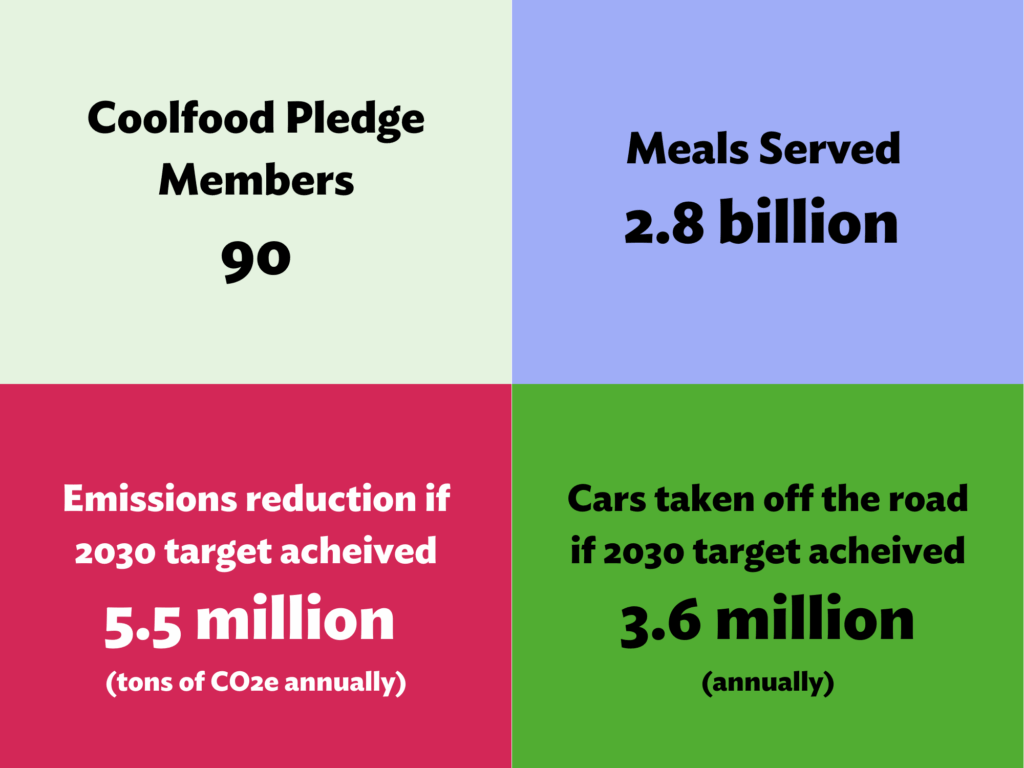
90 food service providers have committed to Coolfood’s science-based target — known as the Coolfood Pledge — to reduce food-related emissions by 25% by 2030 (in line with the broader food systems emissions reductions that are necessary).[i] If all Pledge members achieve this target, their reduced annual emissions will equal 5.5 million tonnes of carbon dioxide equivalent (tCO2e) — comparable to taking approximately 3.6 million cars off the road.[ii]
Each year, Coolfood uses members’ food procurement data to measure collective progress toward the 2030 target. For the first time, this year Coolfood surveyed members to better understand which behavioral science strategies (as detailed in our Food Service Playbook) members are using to promote healthy and environmentally friendly plant-rich menu items – and how those changes to the dining environment impact their food-related emissions. Now in its second edition, our Food Service Playbook presents 90 strategies that WRI’s behavioral scientists have identified as able to boost demand for plant-rich dishes.
This report shares Coolfood Pledge members’ progress through 2024 alongside survey insights, offering a look at the realities food providers face on the frontlines of serving healthier, low carbon food and what others can learn as a result. [iii]
A Reality Check – and a Call for Action
Few industries were hit harder by COVID-19 than food service. Jobs were lost, supply chains collapsed, and many businesses didn’t survive. 2024 marked members’ first full year of recovery from the pandemic slowdown, as food purchases saw a complete rebound. With more meals being served compared to pre-pandemic baselines, emission reductions have plateaued.
But there’s a critical shift underway: as more providers embrace plant-forward menus, they are proving it’s possible to grow their operations while reducing emissions. This report offers practical insights into what’s working and where progress is being made.
Still, there’s no escaping the reality: cutting food-related emissions is hard work. The targets are clear, but achieving targets requires persistence, investment, and collaboration. This is particularly true without policy to drive widespread action.
Hard doesn’t mean not worth the work, though. It’s time to double down on our commitment, our creativity, and our collective effort. Every step forward, big or small, brings us closer to a sustainable food future for all. And that’s worth it.
Read on for further information.
Emission reductions per plate have plateaued, but all sectors continue to move in right direction
Since 2023, we have analyzed sector-level progress toward the 2030 target and how much the cohort has reduced its GHG emissions “per plate.” [iv] The Coolfood Pledge has a sub-target to reduce “per plate” emissions by 38% by 2030. [v] Some Coolfood Pledge signatories (e.g., cities, contract caterers) serve food in multiple types of operations (e.g., schools, universities, government agencies, etc.); members are analyzed according to the entity that signed onto the Pledge, rather than where the food is served.
Table 1 provides an update on sector-level progress for emissions “per plate” by the 93 members who took the Coolfood Pledge prior to 2024. [vi] Collectively, they serve more than 2.8 billion meals every year. The number of meals served varies across members and sectors; our largest sector, contract caterers and restaurants, serve 83% of total meals. Table 1 excludes those members who joined the Coolfood Pledge in 2024-25 because they have not had sufficient time to implement changes that can be reflected in data through 2024.
Table 1: Changes in GHG emissions “per plate” by sector, from baseline through 2024
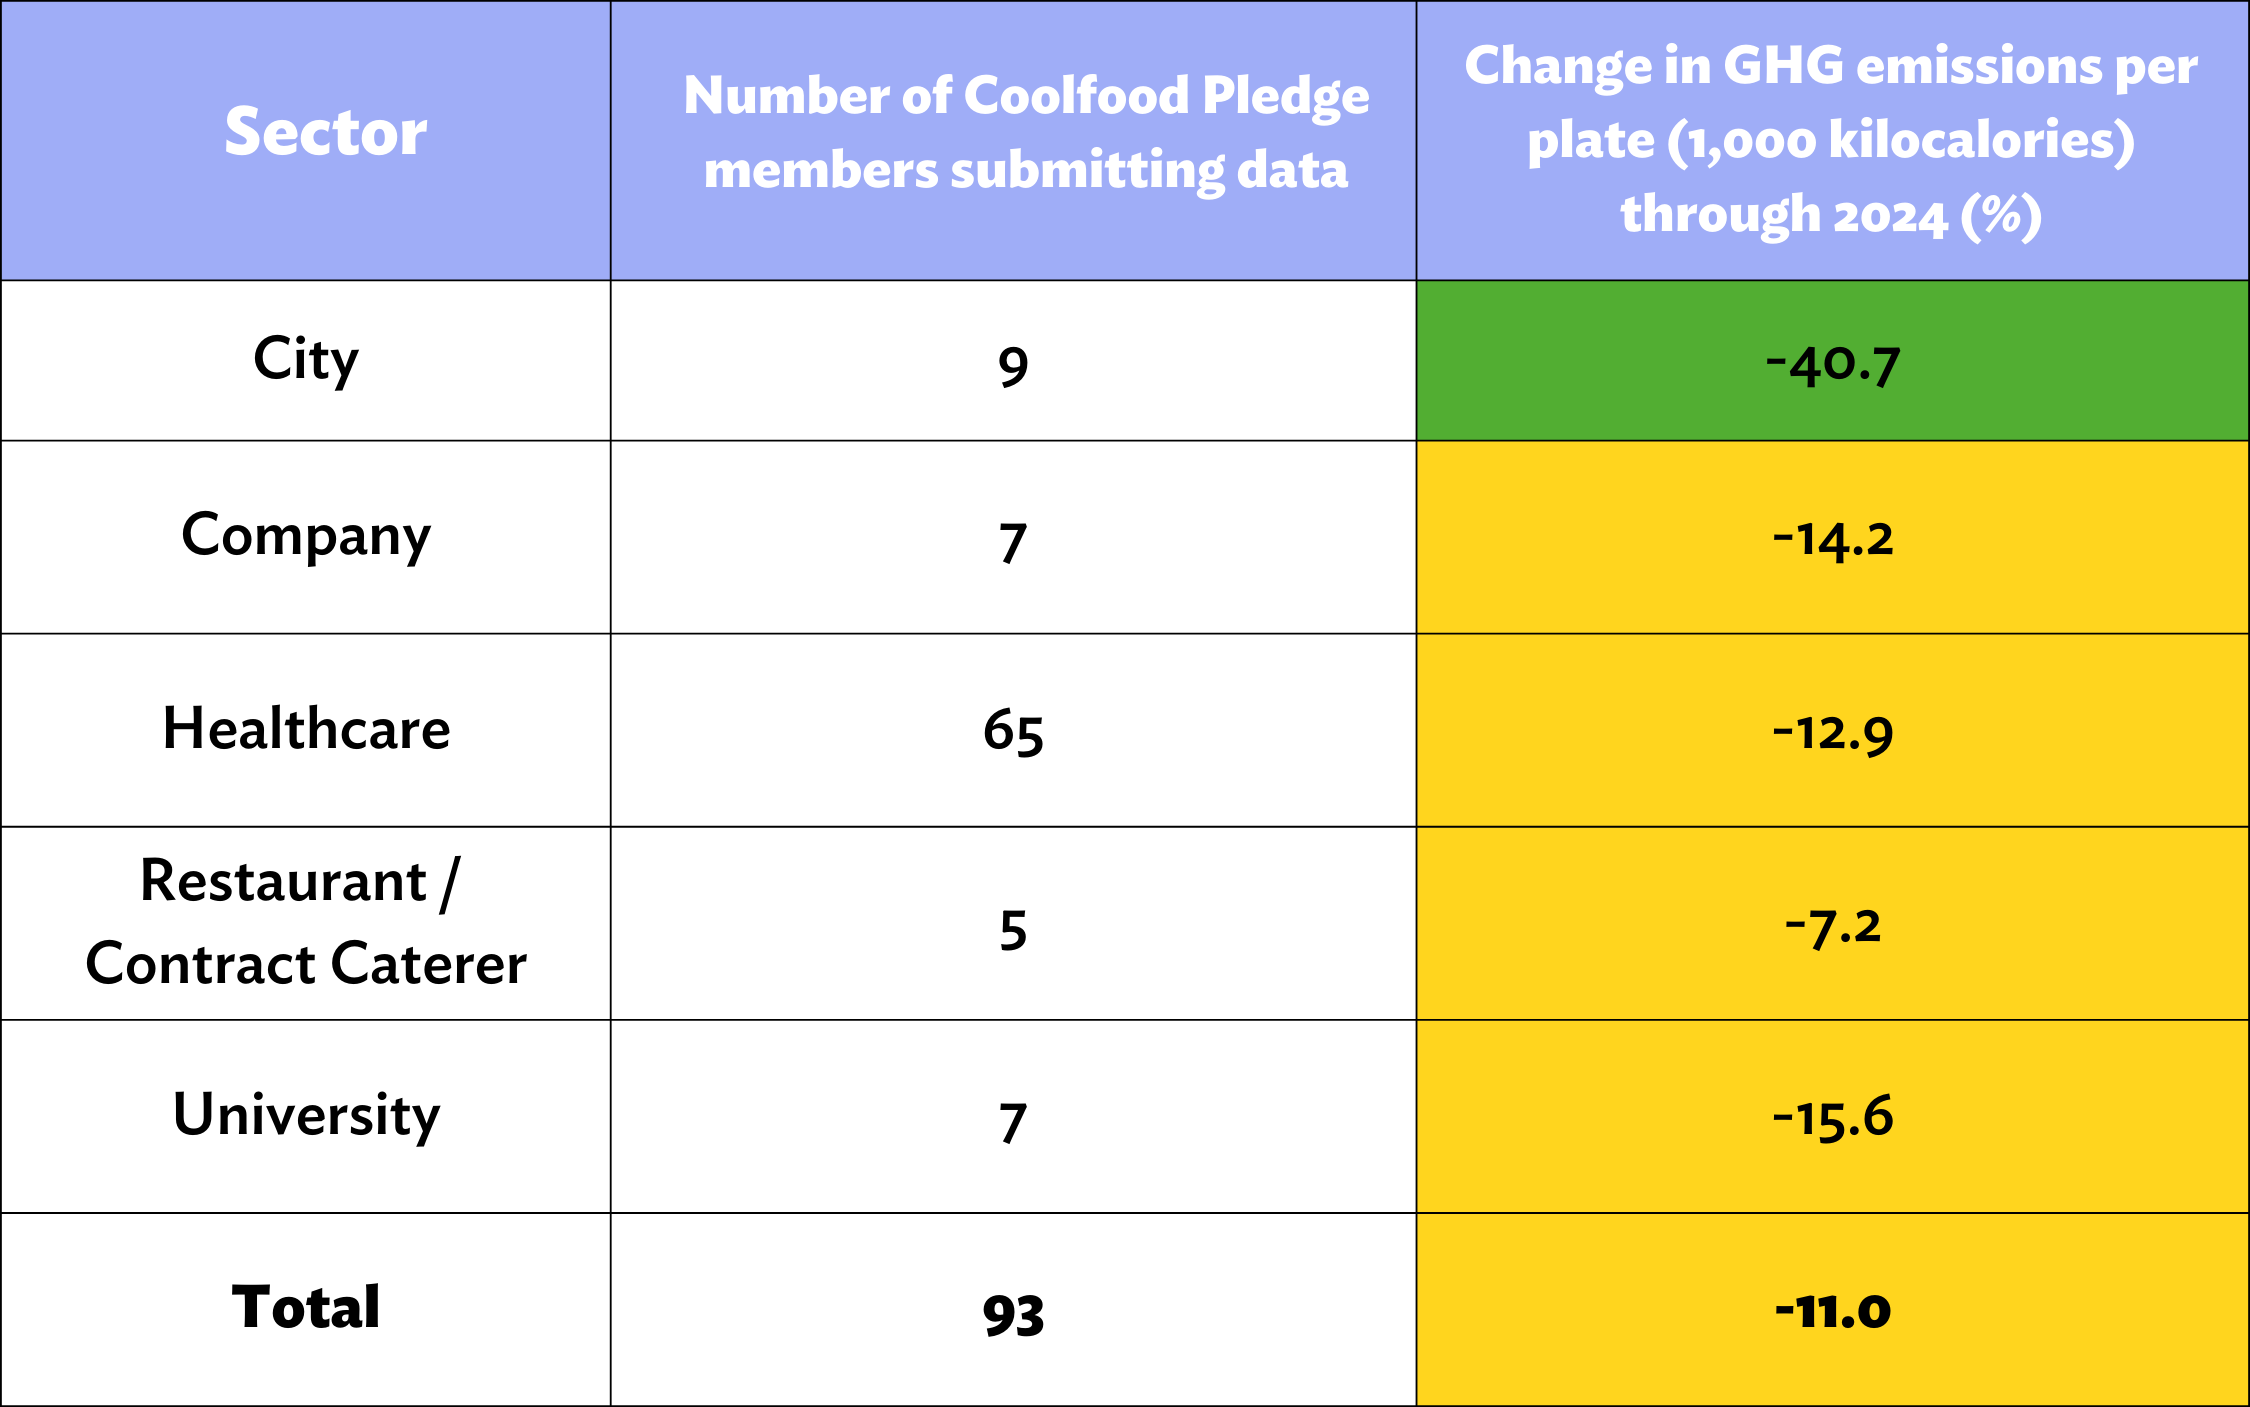
Notes: Trends shown for active members who joined the Coolfood Pledge prior to 2024. Reductions highlighted in green are ahead of the pace needed for 2030, whereas yellow indicates moving in the right direction but not at the right pace; through 2024, a minimum 22.8% reduction would be considered on track. This table includes data from 21 members that has been held constant through 2024 due to delayed reporting, representing 9.7% of meals; assuming that members continue to make progress in reducing emissions each year, holding emissions constant for members without recent data likely underestimates total cohort progress. Sources: Member data; Poore and Nemecek (2018) (agricultural supply chain emissions); Searchinger et al. (2018) (carbon opportunity costs).
This data tells us that all sectors are moving in the right direction by reducing their “per plate” GHG emissions, with the total cohort achieving an overall 11% reduction in emissions “per plate” from base year. [vii] It’s worth noting that this is a similar level of progress to 2023, when “per plate” emissions dropped by 12% across all sectors. Nevertheless, reducing an operation’s food emissions is no small task and we celebrate the progress being made. Figure 1 shows each sector’s progress in reducing emissions ”per plate” over time.
Figure 1: Changes in GHG emissions per plate by sector over time
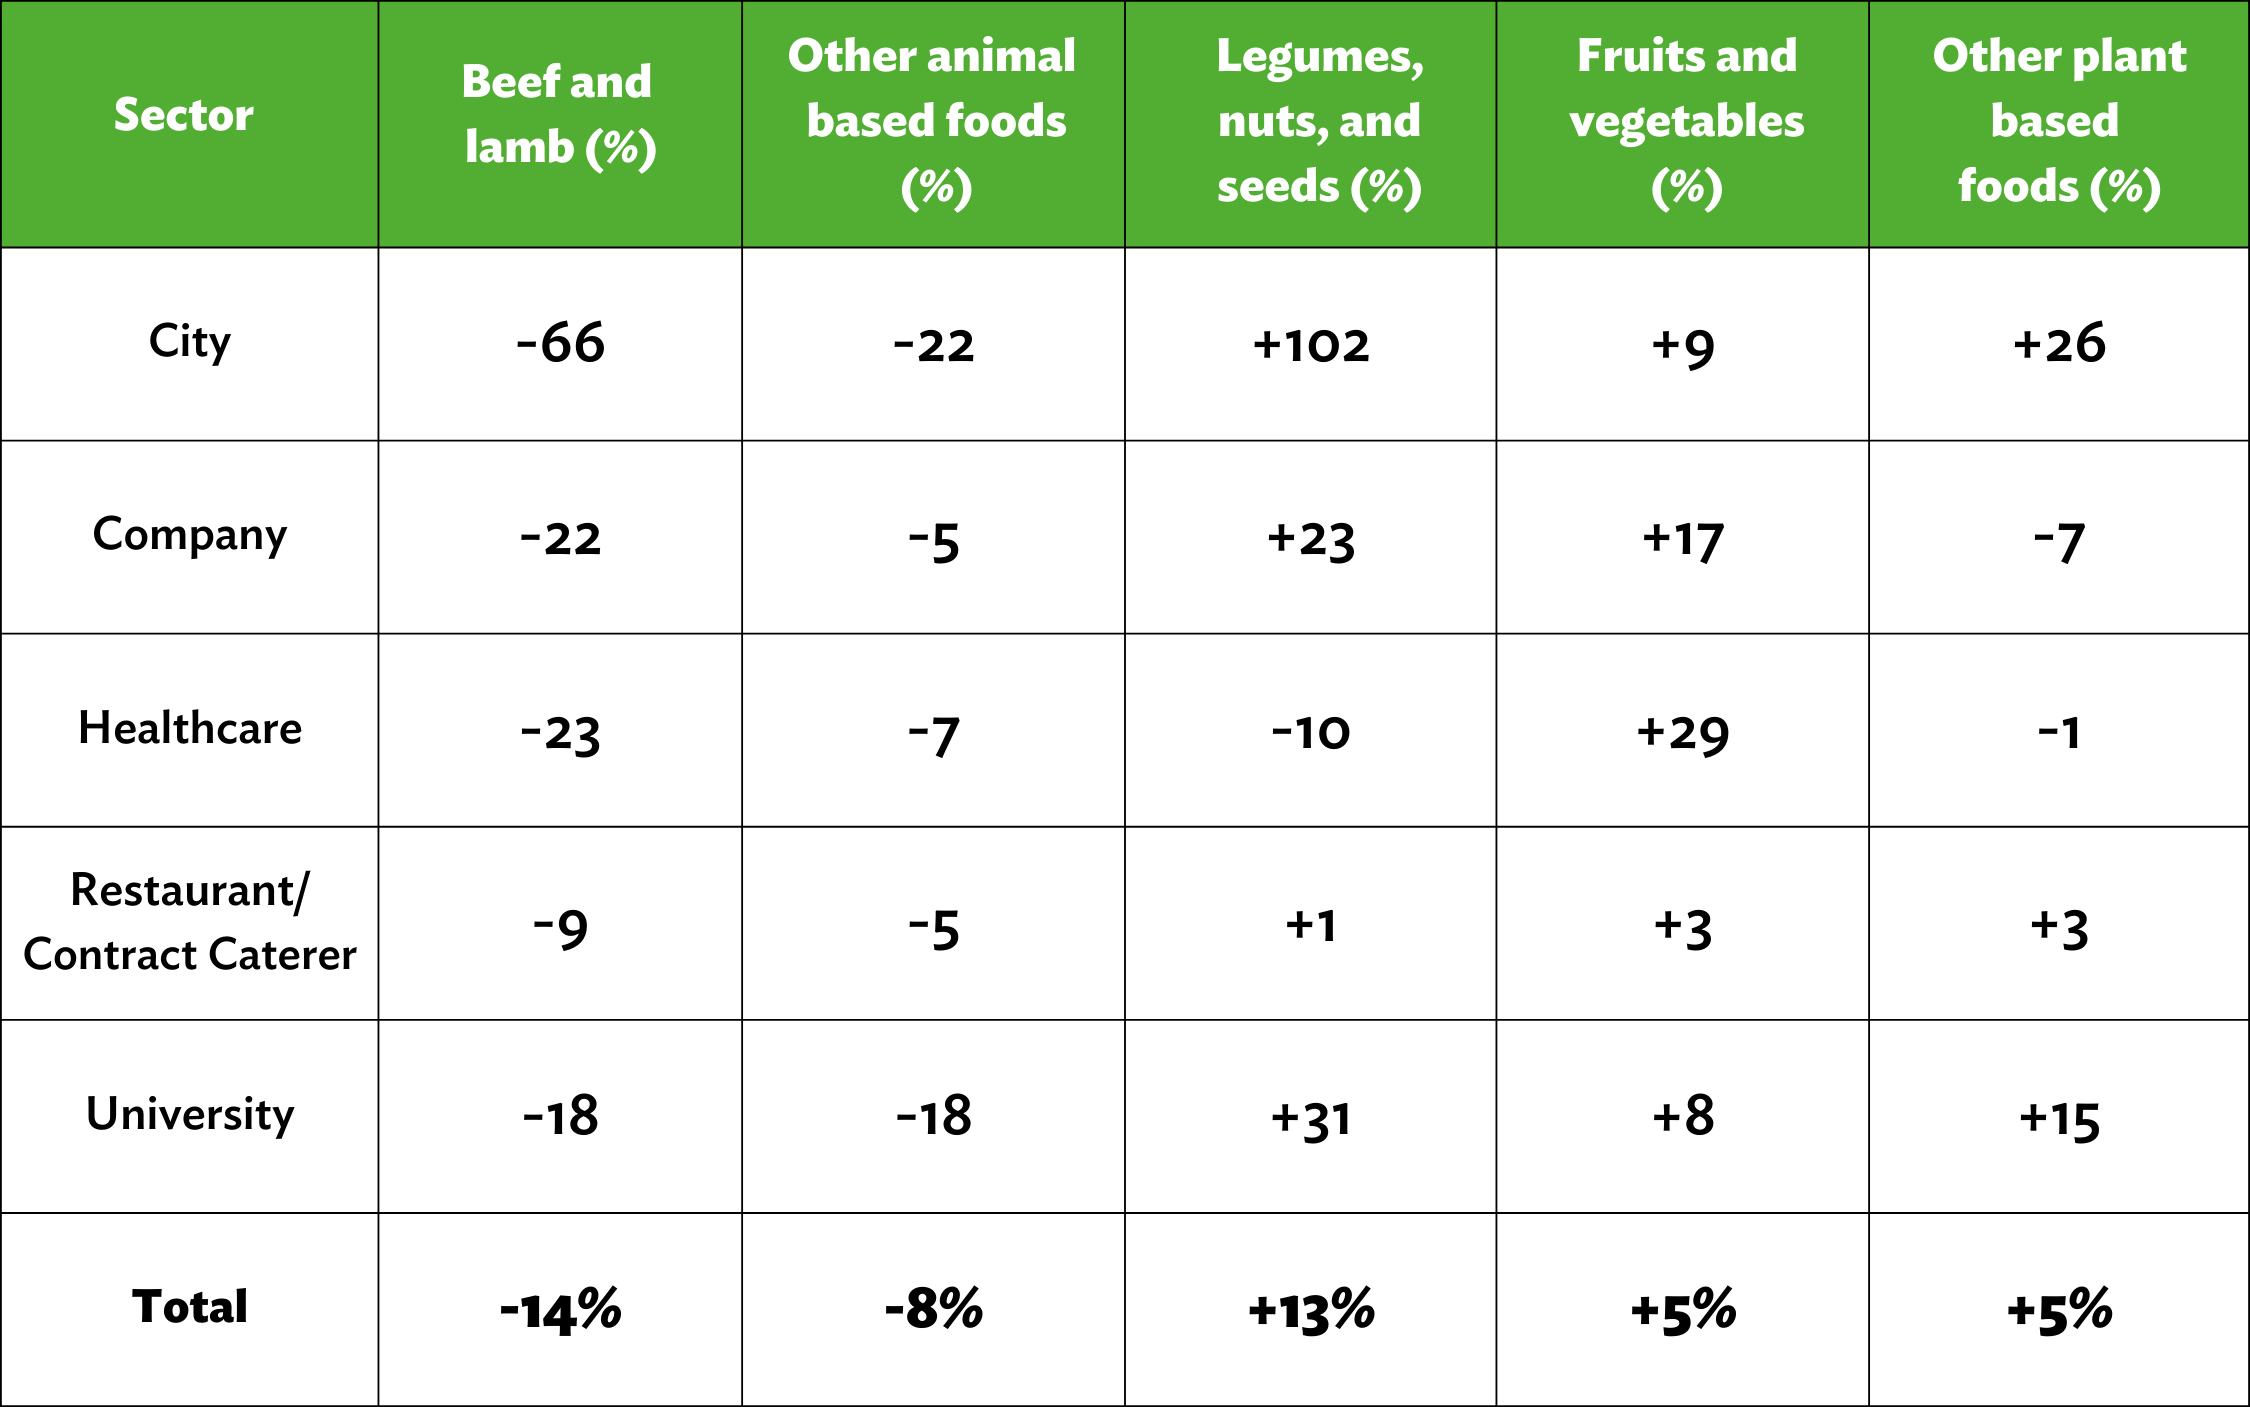
Cities stand out, as they continue to make progress far ahead of the pace needed to meet the 2030 target on time. [viii] They’ve achieved this by decreasing the average share of beef and lamb on their plates by 66%, along with a 22% decrease in the average share of other animal-based foods on the plate. At the same time, cities have increased the share of plant-based foods on the average plate by 20%, with a notable doubling of the share of legumes, nuts and seeds on the plate (Table 2). Together these shifts helped cities reduce ”per plate” emissions by 41% through 2024 — well beyond the 23% needed to be considered on track. [ix]
While overall sector progress has slowed, we see meaningful shifts in what’s being served. Members continue to reduce ”per plate” emissions by serving less animal-based foods, particularly beef and lamb, and serving more plant-based foods (Table 2). Members have grown the share of the plate dedicated to legumes, nuts and seeds by 13% and to fruits and vegetables by 5%, advancing diets rich in fiber, vitamins and minerals that support people’s health — along with being better for the planet (Table 2).
Member Spotlight: Ghent
In Ghent, chefs from the city’s catering company receive ongoing training to create innovative dishes for school children. The city tries out specially designed dishes with legumes, taste tests them, then puts the recipes on the menu several times – all while also checking with kitchen staff, the children, and the caretakers to see how the children are enjoying the dishes.
Table 2: Changes in the share of food types on the average plate by weight (kilograms) through 2024
Many new healthcare members have joined Coolfood, impacting overall progress against targets
In 2023, 40 new healthcare members signed onto the Coolfood Pledge through our partnerships with Healthcare Without Harm US, Healthcare Without Harm EU, and Nourish. This more than doubled the number of Coolfood’s healthcare members. With this increase, the majority of healthcare members only had one year of engagement with Coolfood before reporting procurement data through 2024. It’s not surprising to see that the overall healthcare sector progress appears more limited, as the newest joiners need time to shift their food purchases to start making greater progress against the target. However, progress by healthcare members who joined earlier shows what’s possible.
Member Spotlight: UC San Diego Health
UC San Diego Health (a Coolfood member since 2019) has reduced their emissions “per plate” by improving the appearance of plant-rich dishes — one of the product strategies outlined in the Food Service Playbook. They crafted beautiful self-service displays and intricate presentations of plant-rich dishes to better showcase these options to diners. They also incorporated ingredient stacking, integrated brightly colored ingredients and added attractive garnishes, which made the plant-rich dishes more appealing to consumers and increased their uptake.
With plant-forward plates, operations can grow while emissions fall
Looking at emissions “per plate” enables us to more fully understand progress despite food service interruptions from the COVID-19 pandemic, when people avoided eating outside their homes. However, it is also important to consider total (absolute) emissions.
As a result of fewer people eating out during the COVID-19 pandemic, Pledge members’ food purchasing significantly dropped during 2020 and 2021, which resulted in artificially large decreases in absolute emissions. In 2022 and 2023, these absolute emissions rebounded as people ate out more again and food purchases recovered. Now, when looking at data through 2024, we see a complete recovery from these impacts and a return to normal business growth, with many members serving more meals in 2024 than they did prior to the pandemic.
Overall, the group reduced absolute emissions by 4% between the base year and 2024. This drop in total emissions happened even as they increased their total food purchases (by weight) by 11%, compared to the base year. Also noteworthy is that while absolute emissions have rebounded, they have not increased past baseline levels, due to lower “per plate” emissions.
This is a significant development because it shows that food emissions can drop even as business and operations grow. Essentially, shifting what’s on each plate (more low-carbon plant-based foods and less resource-intensive meat and dairy) works to decouple food purchases and emissions.
Member Spotlight: IKEA
IKEA has improved and expanded their plant-based food selection to offer customers more options for healthier, low-carbon dishes. They introduced a plant ball that replicates the sensory experience of their iconic traditional meatball, with a focus on taste and texture that appeals to meat-eaters and vegetarians alike. The plant ball is primarily made from pea protein, which helps mimic the texture and protein content of meat. They have also introduced a plant-based version of their hot dog, which has been a nostalgic part of the IKEA shopping experience for over 40 years.
However, the 4% reduction is no longer on track for meeting the target by 2030. To be on track, members would have needed to reduce absolute emissions by 15% through 2024. [x] To get back on track, members will need to decrease both absolute and relative emissions further in 2025 and beyond.
One pathway for members to achieve a 25% reduction by 2030 could be to reduce their collective ruminant meat purchases by 10% per year from now until 2030 while increasing the share of plant-based food they serve and reducing other animal-based food.
We estimate that the total food-related carbon emissions costs of these members were 20 MtCO2e in 2024, including 4.7 MtCO2e from agricultural supply chains and 16 MtCO2e from annualized carbon opportunity costs. [xi] Among members who joined before 2024, animal-based foods accounted for 85% of their total food-based GHG emissions in 2024 — with beef and lamb alone accounting for 52% — and plant-based foods accounted for 15% of emissions (Figure 2).
Figure 2: Changes in Coolfood Pledge members’ absolute GHG emissions through 2024
Progress grows with time and demand shift strategy adoption
Members who have been in Coolfood the longest have had the most time to implement actions. As a result, we are seeing these members make the most progress. Members who joined in 2018-2020 have achieved the most progress to date compared to members who joined in 2021-2023 (15% vs. 9% reduction from baseline to 2024, respectively).
In the inaugural year of the Action Accelerator survey, Coolfood’s new approach to tracking which behavior change strategies members are using, 46 respondents from 23 countries completed the survey. This included representatives from the healthcare, university, restaurant, city and company sectors, for a member response rate of 24%. While respondents were largely representative of the distribution of members across sectors, they served 18% fewer meals on average than members overall. Moreover, the overall low response rate means survey results may not be widely applicable. The survey asks members about a range of techniques across the Food Service Playbook’s six groupings: Price, Placement, Promotion, Presentation, Product and People. The survey results help us better understand how respondents are promoting healthy and environmentally friendly, plant-rich food choices in their establishments, and how specific changes in the food choice environment affect their food-related emissions.
Survey results indicated that respondents most often employ “product strategies” — strategies that involve modifying the food products served, such as increasing the variety of plant-rich foods on offer or improving their taste and appearance. Product strategies accounted for 6 of the top 10 most used strategies, with 80% of respondents employing the strategy to increase the variety of plant rich dishes, 79% employing the strategy to improve the appearance of plant rich dishes and 76% employing the strategy to improve flavor and texture of plant rich dishes. The data suggests that respondents employing product strategies for 6 months or longer achieved bigger drops in emissions, and the more product strategies members used, the greater their emissions reductions. The product strategy that most strongly predicted emission reductions was increasing the variety of plant-rich foods offered. To more conclusively understand relationships between specific strategies and emissions reductions, we need a higher response rate for the survey.
Member Spotlight: Tetra Pak
At Tetra Pak’s site in Aarhus, Denmark, 41% of all meals served are plant-rich. They’ve achieved this by reducing meat in dishes with plant-based substitutes, enhancing flavor with spices and herbs, and improving presentation with color-coded environmental messaging labels and restaurant-style plating.
Progress varies – but most members need to pick up the pace
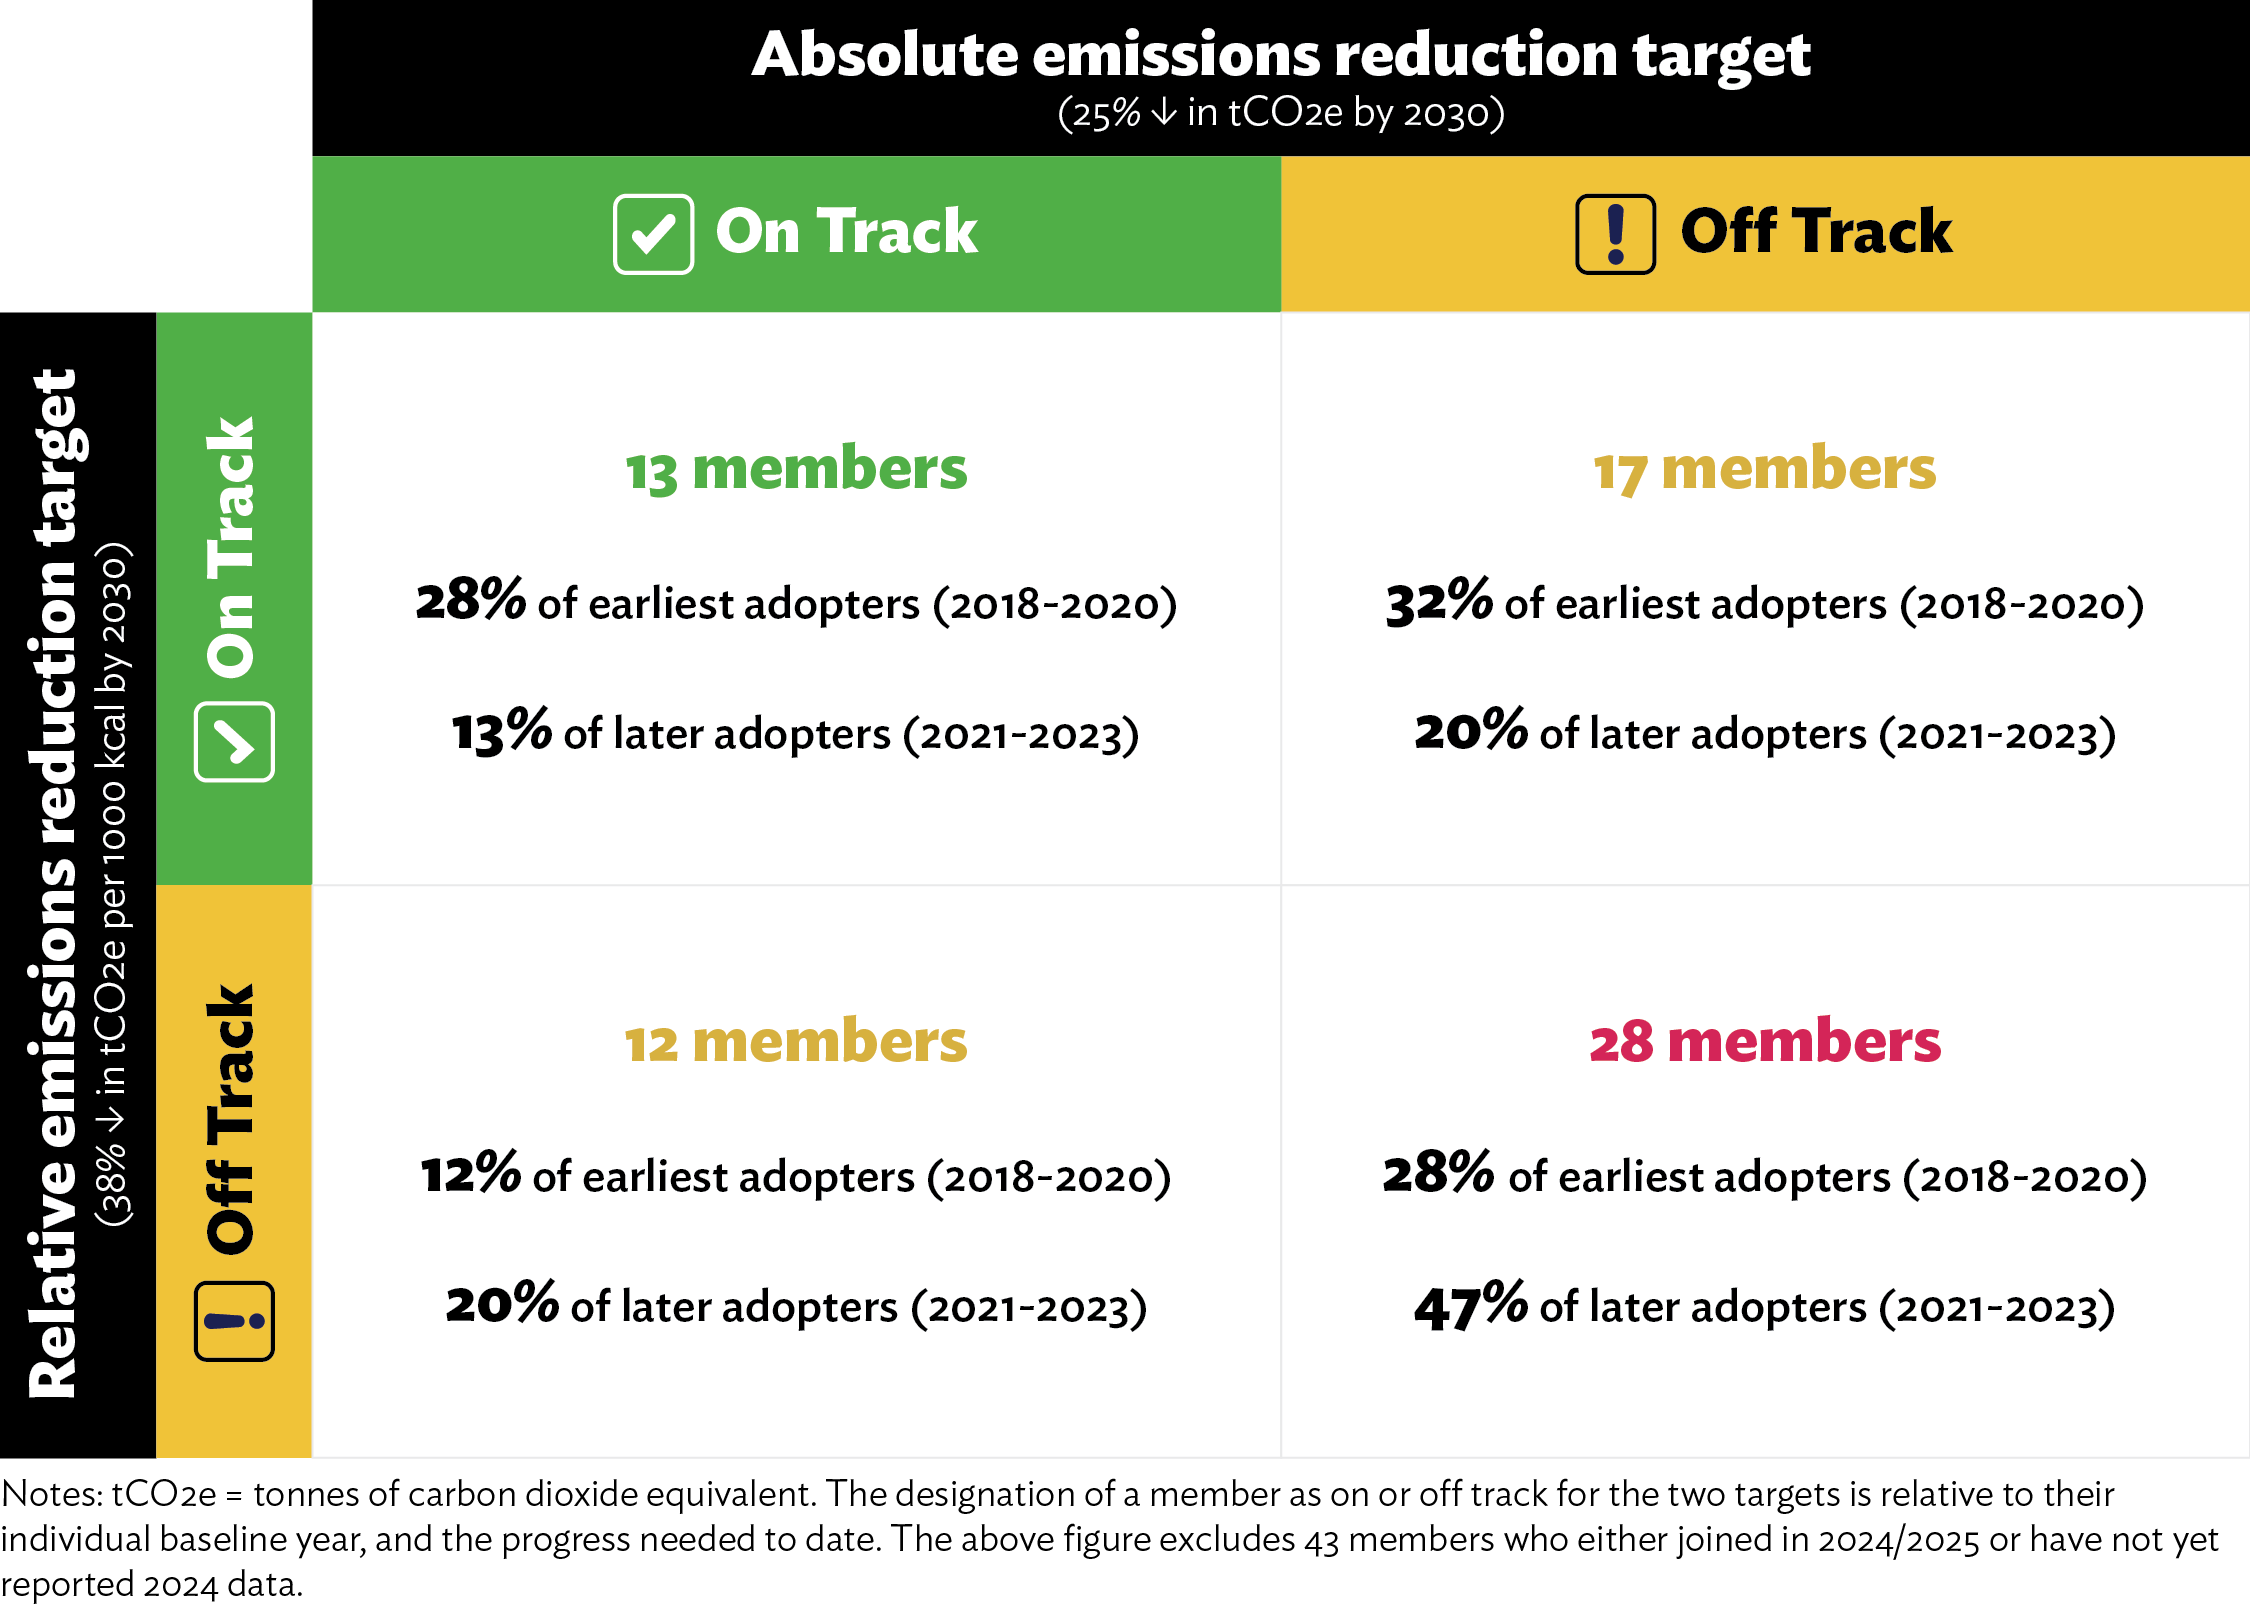
The above metrics track Coolfood Pledge progress across all members, reflecting progress at the sector and cohort level. However, on an individual level, member progress is more varied. Table 3 shows how Pledge members are on or off track for the absolute emissions reduction target and the “per plate” emissions reduction target.
Overall, 19% of members are on track for both the absolute and “per plate” target, while 40% of members are off track for both targets (Table 3). More members are on track for the “per plate” target and off track for the absolute target, as opposed to vice versa – reflecting the greater progress that we are seeing against the “per plate” target compared to the absolute target through 2024.
When looking at the split by cohort for our earliest adopters (members who joined in 2018-2020) and later adopters (members who joined in 2021-2023), we see that more of the earliest adopters (72%) are on track for at least one target compared to the later adopters (53%). This reflects greater progress by these earliest adopters, with more time in the Pledge. At the same time, the earliest adopters are also setting an example for later adopters, demonstrating that change is possible.
Table 3: Individual Pledge member progress status through 2024 against targets
How members can achieve bigger results
While the product strategies were the most popular, survey responses showed that many proven behavioral science strategies, especially those around pricing, are underutilized, such as using coupons or loyalty cards or implementing a tax on meat. These underutilized strategies highlight an opportunity for food service providers to achieve further GHG reductions by implementing additional strategies.
We recommend that members plan to complete our next Action Accelerator survey in 2026. A higher response rate will allow us to better understand trends between the adoption of specific behavior change strategies and changes in emissions, and potentially help respondents more closely track the impact of different interventions. The results will provide the strongest insights yet into what’s working as food providers shift toward healthy, sustainable offerings. By pooling this information across the cohort, members will gain access to attainable, practical insights years sooner than they could on their own.
Finally, we encourage all food service operators interested in jump starting their behavior change journey to reach out to Coolfood to schedule behavior change sessions and learn more about our offerings.
Coolfood’s newest members
In 2024-25, 20 new members joined the Coolfood Pledge. We report their figures separately because they did not have sufficient time to implement changes and see emissions drop in 2024. We estimate that the total food-related carbon costs of these members were 1 MtCO2e in 2024, including 0.2 MtCO2e from agricultural supply chains and 0.8 MtCO2e from annualized carbon opportunity costs.
The newest members of the Coolfood Pledge serve 134 million meals each year. They will need to change their food procurement immediately as they work to reduce their absolute and “per plate” emissions to get on track for 2030. We recommend that these members adopt behavior change strategies across their operations in order to accelerate the necessary shifts in food purchases.
Learn more
More on methods and data sources: Coolfood Pledge technical note
More on behavior change: Food Service Playbook
Previous GHG estimates:
- Coolfood Pledge: 2023 Collective Member Progress Report
- Coolfood Pledge: 2022 Collective Member Progress Report
- Coolfood Pledge: 2021 Collective Member Progress Report
- Coolfood Pledge: 2020 Collective Member Progress Report
- Coolfood Pledge: 2019 Collective Member Progress Report
- Coolfood Pledge: 2015-2018 Base Year GHG Estimate
Endnotes
[i] This report includes data from 90 food service providers that have signed the Pledge at the organizational level, including 70 who joined before 2024 and 20 that joined in 2024-2025. Of these food service providers, 7 track and report progress against the Pledge target at a site-specific level, bringing the total to 113 sites reporting data. For the sector level breakouts below, we report progress for 93 member sites that joined before 2024.
[ii] For passenger cars in Europe, data from the European Environmental Agency (2020) and Helmers et al. (2019) suggest that the average tailpipe emissions of European cars in 2018 were 1.51 tCO2e per vehicle per year (120.8 grams CO2 per kilometer [km] * 12,500 km = 1.51 tCO2e).
[iii] This report was written by Clara Cho and Raychel Santo. Thanks to Jillian Holzer, Anne Bordier, and Laura Malaguzzi Valeri for their helpful review.
[iv] Food-related emissions “per plate” are calculated as food-related emissions per 1,000 kilocalories.
[v] As detailed further in the Coolfood Pledge technical note, global food demand (measured in crop calories) is projected to grow by 21% between 2015 and 2030. Reducing absolute food-related emissions by 25% while accommodating a 21% growth in food demand implies a necessary reduction in emissions per calorie of 38% during that period.
[vi] In the data year 2023, we reported on progress for members who had joined the Coolfood Pledge prior to 2023. For this report (covering 2024 data), we have updated this cohort to reflect the year of progress made by members who joined the pledge in 2023.
[vii] The base year for the Coolfood GHG reduction target is 2015, but food purchase data from as far back as 2015 were unavailable for most members. We therefore accepted baseline data for any year between 2015 and 2023 for the purposes of establishing a group baseline, as detailed in the Coolfood Pledge technical note.
[viii] City progress includes data from two city members that has been kept constant through 2024 because they have not yet submitted 2024 data. Assuming that members continue to make progress in reducing emissions per year, holding emissions constant likely underestimates current trend data.
[ix] A 38% decline by 2030, relative to 2015, would imply a 22.8% decline would be needed by 2024 assuming linear progress after these first nine years [(38 / 15) * 9 = 22.8].
[x] A 25% decline by 2030, relative to 2015, would imply that a 15% decline would be needed by 2024 assuming linear progress in these nine years [(25 / 15) * 9 = 15].
[xi] Agricultural supply chain emissions include emissions associated with the production of food and animal feed as well as food transport, processing, packaging and food losses prior to the point of purchase (Poore and Nemecek 2018). Carbon opportunity costs are the total historical carbon losses from plants and soils on agricultural lands (this quantity also represents the amount of carbon that could be stored if land in agricultural production were allowed to return to native vegetation) and are annualized as in Searchinger et al. (2018). Carbon opportunity costs are important to include because, as Coolfood members shift their purchases to less land-intensive foods, this metric tracks the climate benefits of using less agricultural land and reducing pressure on the world’s remaining natural ecosystems.