2019 Coolfood Pledge GHG Emissions Update
The Coolfood Pledge is a global initiative that helps dining facilities commit to and achieve a science-based target to reduce the climate impact of the food they serve. Coolfood publicly reports the group’s collective greenhouse gas (GHG) emissions annually against a target of reducing GHG emissions by 25% by 2030. This update includes a comparison of 2019 annual data to the base year of 2015 and the 2030 target.
Total Emissions Reduction Through 2019
We received 2019 food purchase data from 31 Coolfood Pledge members covering 98% of the 935 million meals served by the group. We received 2019 data, in addition to 2015-18 baseline data, from 24 members. The trend data shown in this update [1] covers 89% of the total meals served by the group. We estimated total food-related carbon costs in 2019 at 4,062,145 t CO2e, including:
-
- 787,135 t CO2e from agricultural supply chain emissions;
- 3,275,009 t CO2e from annualized carbon opportunity costs;
- Animal-based foods accounted for 87% of the group’s total GHG emissions profile, with ruminant meats alone accounting for 67%; and
- Plant-based foods accounted for 13% of the emissions profile.
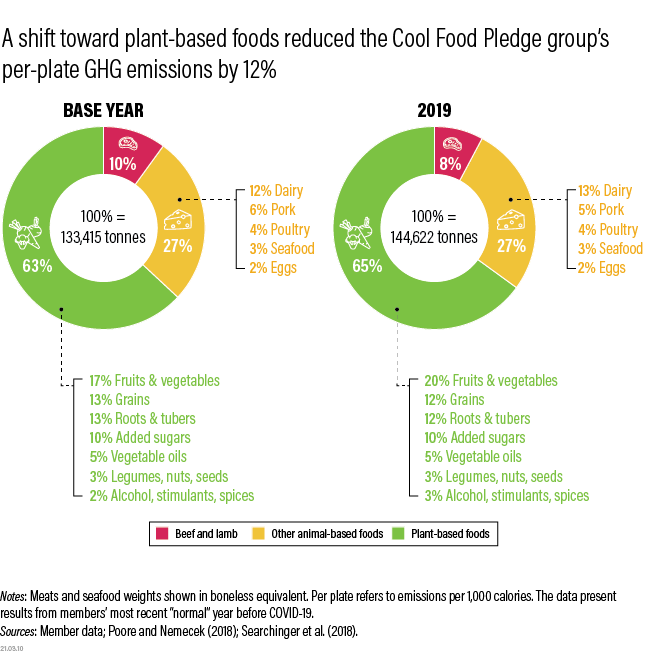
Between the base year and 2019, the group’s total annual food-related GHG emissions (carbon costs) declined by 4.6%. The 4.6% emissions decline was due to a shift in the mix of foods purchased, as ruminant meat purchases decreased by 10% while purchases of plant-based foods (e.g., grains, legumes, nuts, seeds, fruits, vegetables, roots and tubers) increased by 12%. While this emissions decline is encouraging, a 6.7% decline versus the base year was required by 2019 to be on a linear pace for a 25% reduction by 2030. This suggests that Coolfood Pledge members should accelerate the purchasing shift toward plant-based foods to be on pace to hit the target. If the group can hit the 25% target by 2030, it would reduce annual emissions by 1,064,900 t CO2e, equivalent to avoiding the annual tailpipe emissions from roughly 230,000 U.S. passenger vehicles or more than 700,000 EU passenger cars. [2]
Per-Plate Emissions Reductions Account for Growth
To account for growth in Coolfood Pledge members’ businesses (along with global population growth), Coolfood also tracks changes in food-related emissions per calorie (a normalized metric). An easy way to think of this metric is the emissions per plate of food served. The companion target is a 38% reduction in emissions per calorie by 2030, relative to the base year. Encouragingly, the group reduced emissions per calorie by 12% between the base year and 2019, slightly ahead of the pace needed to hit the 2030 target (10.2%). This normalized per-calorie target will be especially important when assessing the Coolfood group’s performance in 2020, due to the large disruptions that the COVID-19 pandemic caused to food service operations, affecting total purchases and sales. We will provide a progress update using the group’s 2020 food purchase data when new data are available.

Through Simple Changes, Coolfood Pledge Members Are Seeing Big Results
Genentech, which has 10,000 staff based in California, has changed their chef specials to plant-rich options — serving dishes including “Vegan Jackfruit, Okra and Seitan Jambalaya” with brown rice, Creole sauce and shaved scallions as well as “Charred Yucatan Vegetables” with carrots, yellow squash, zucchini, stewed black beans, habanero pickled red onions and flour tortillas. Following positive responses from employees, demand for the new plant-rich options has grown while demand for the more traditional, meat-heavier options has declined. From 2018 to 2019 alone, the company has reduced the climate impact of each plate of food they serve by an incredible 33%.
UCSF Health has decided to couple a more climate-friendly ethos with a cost-effective one while feeding patients and visitors. UCSF had a 100% beef burger that wasn’t selling well, so they switched to a 70:30 beef/mushroom blended burger in 2017 that sold better. The burger costs less, the mushrooms ensure it remains flavorful, and the reduction in beef helps UCSF Health hit its climate-friendly target for food. At the same time, UCSF’s central menu has evolved from serving 20 entrees featuring beef in 2017 down to just three by 2020. UCSF Health’s total food-related GHG emissions have dropped by 13% in just three years.
University of Cambridge’s University Catering Service, which manages 14 cafés and canteens and caters for 1,500 events a year, has phased out ruminant meat completely. Guests now enjoy Swedish-style Vegballs, Smoky Moroccan Chickpea Stew, and Sweet Potato Burgers. Emissions have dropped by more than 30% even as the university has served 30% more food, reflecting the significant change in the ingredients that make up the meals they are serving.
Read more on our blog “Climate-Friendly Food Is Easier Than We Think.”
Learn More
Please see the Coolfood Pledge technical note and 2015-18 baseline estimate for more information on data sources and methods.
[1] This update was prepared by Richard Waite and Gerard Pozzi. Thanks to Daniel Vennard and Liqing Peng for their helpful reviews.
[2] This equivalency is taken from the U.S. Environmental Protection Agency’s GHG Equivalency Calculator (EPA 2019), and is calculated using data from the United States in 2017. “Passenger vehicles” include passenger cars, vans, pickup trucks, and sport utility vehicles, and tailpipe emissions averaged 4.63 t CO2e/vehicle/year. For passenger cars in Europe, data from EEA (2018) and Helmers et al. (2019) suggest that the average tailpipe emissions of European cars in 2018 were 1.5 t CO2e/vehicle/year.
