2021 Coolfood Pledge Collective Climate Impact Report
The Coolfood Pledge is a global initiative that helps dining facilities commit to and achieve a science-based target to reduce the climate impact of the food they serve. Coolfood publicly reports the group’s collective greenhouse gas (GHG) emissions annually against a target of reducing absolute GHG emissions by 25 percent by 2030. This update reports progress through 2021 toward the 2030 target.[1] Because COVID-19 affected total food purchases, this update also includes an estimate of the reduction in GHG emissions “per plate” through 2021.[2] Coolfood’s sub-target is a 38 percent reduction in emissions per plate by 2030.[3]
The Coolfood Movement is Growing
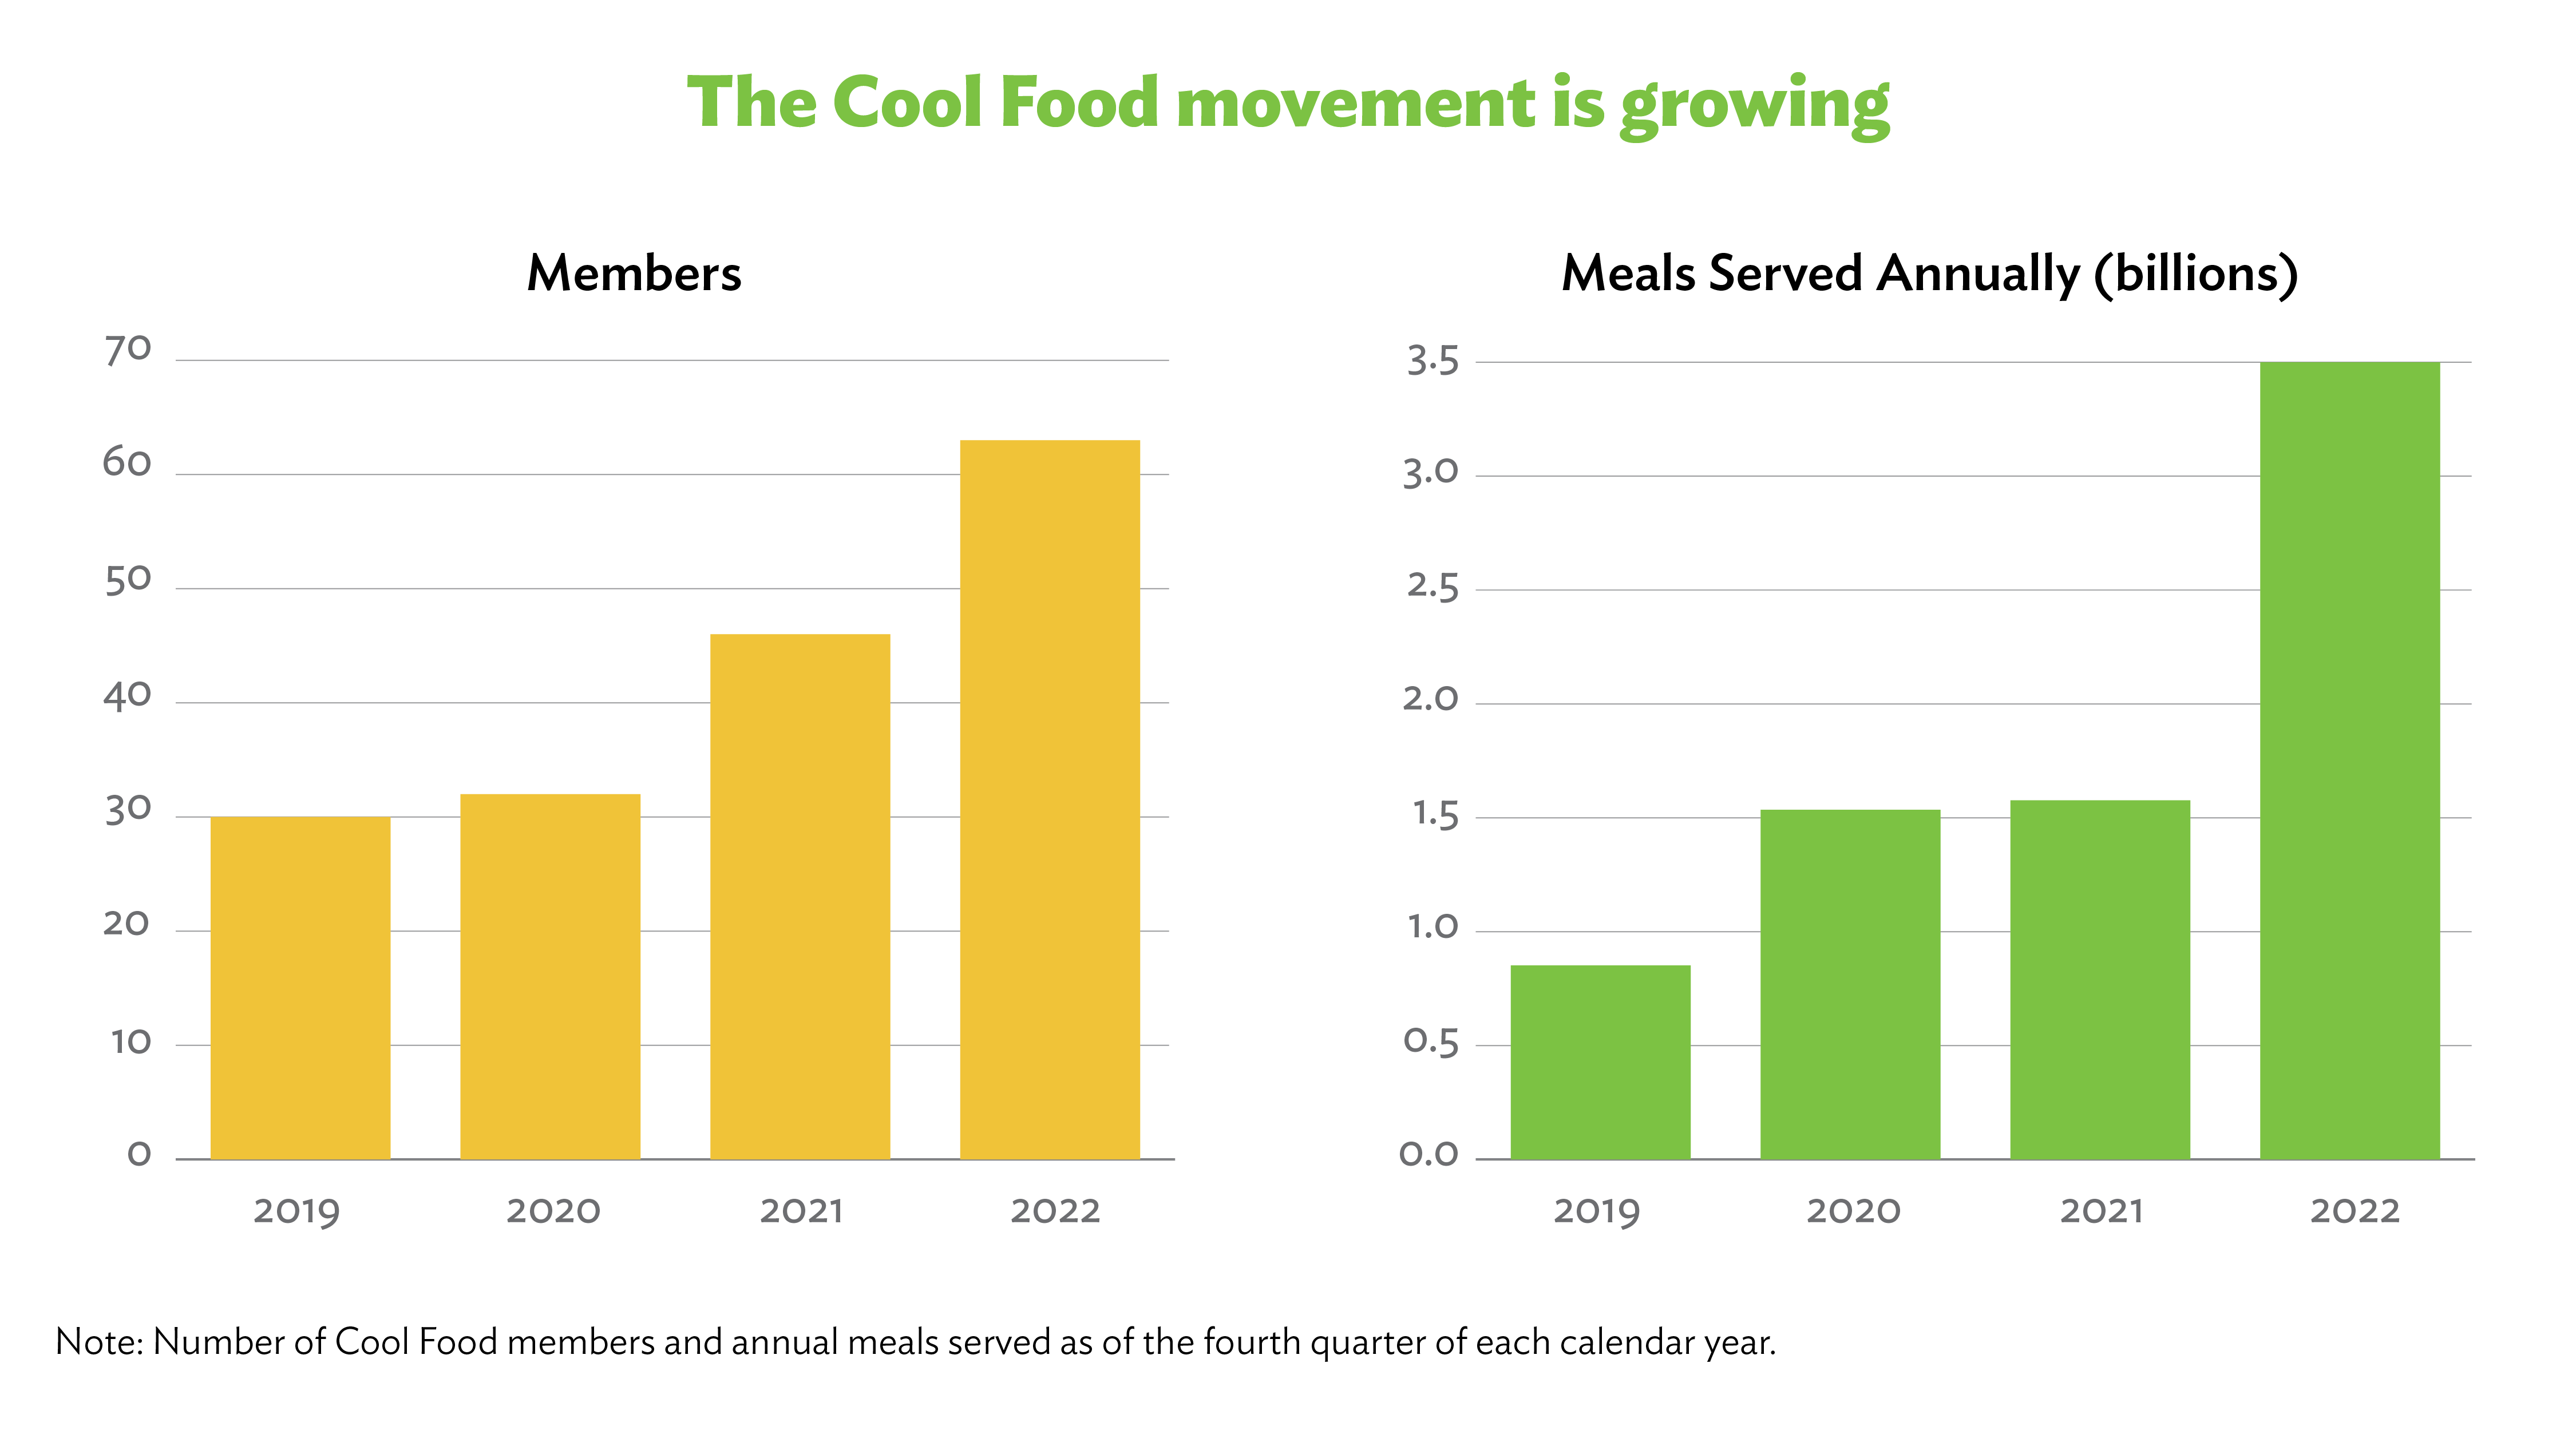
Despite ongoing challenges related to COVID-19 in food service, Coolfood membership grew throughout 2021 and 2022 and now stands at 63 members serving approximately 3.5 billion meals per year.

A total of 61 Coolfood members accounting for nearly 2.8 billion meals per year have taken the Coolfood Pledge. We received 2021 food purchase data from 48 Coolfood Pledge members, covering 99 percent of the meals served annually by the group.[4] To most accurately represent progress by the group, we split our members into two cohorts: the early adopters, a group of 30 members serving about 840 million meals per year who use a GHG emissions base year between 2015 and 2018; and the recent adopters, a group of 31 members serving about 1.9 billion meals per year who use a base year between 2019 and 2021.
Early Adopters: GHG Emissions per Plate Fell by 21 Percent Between the Base Year and 2021
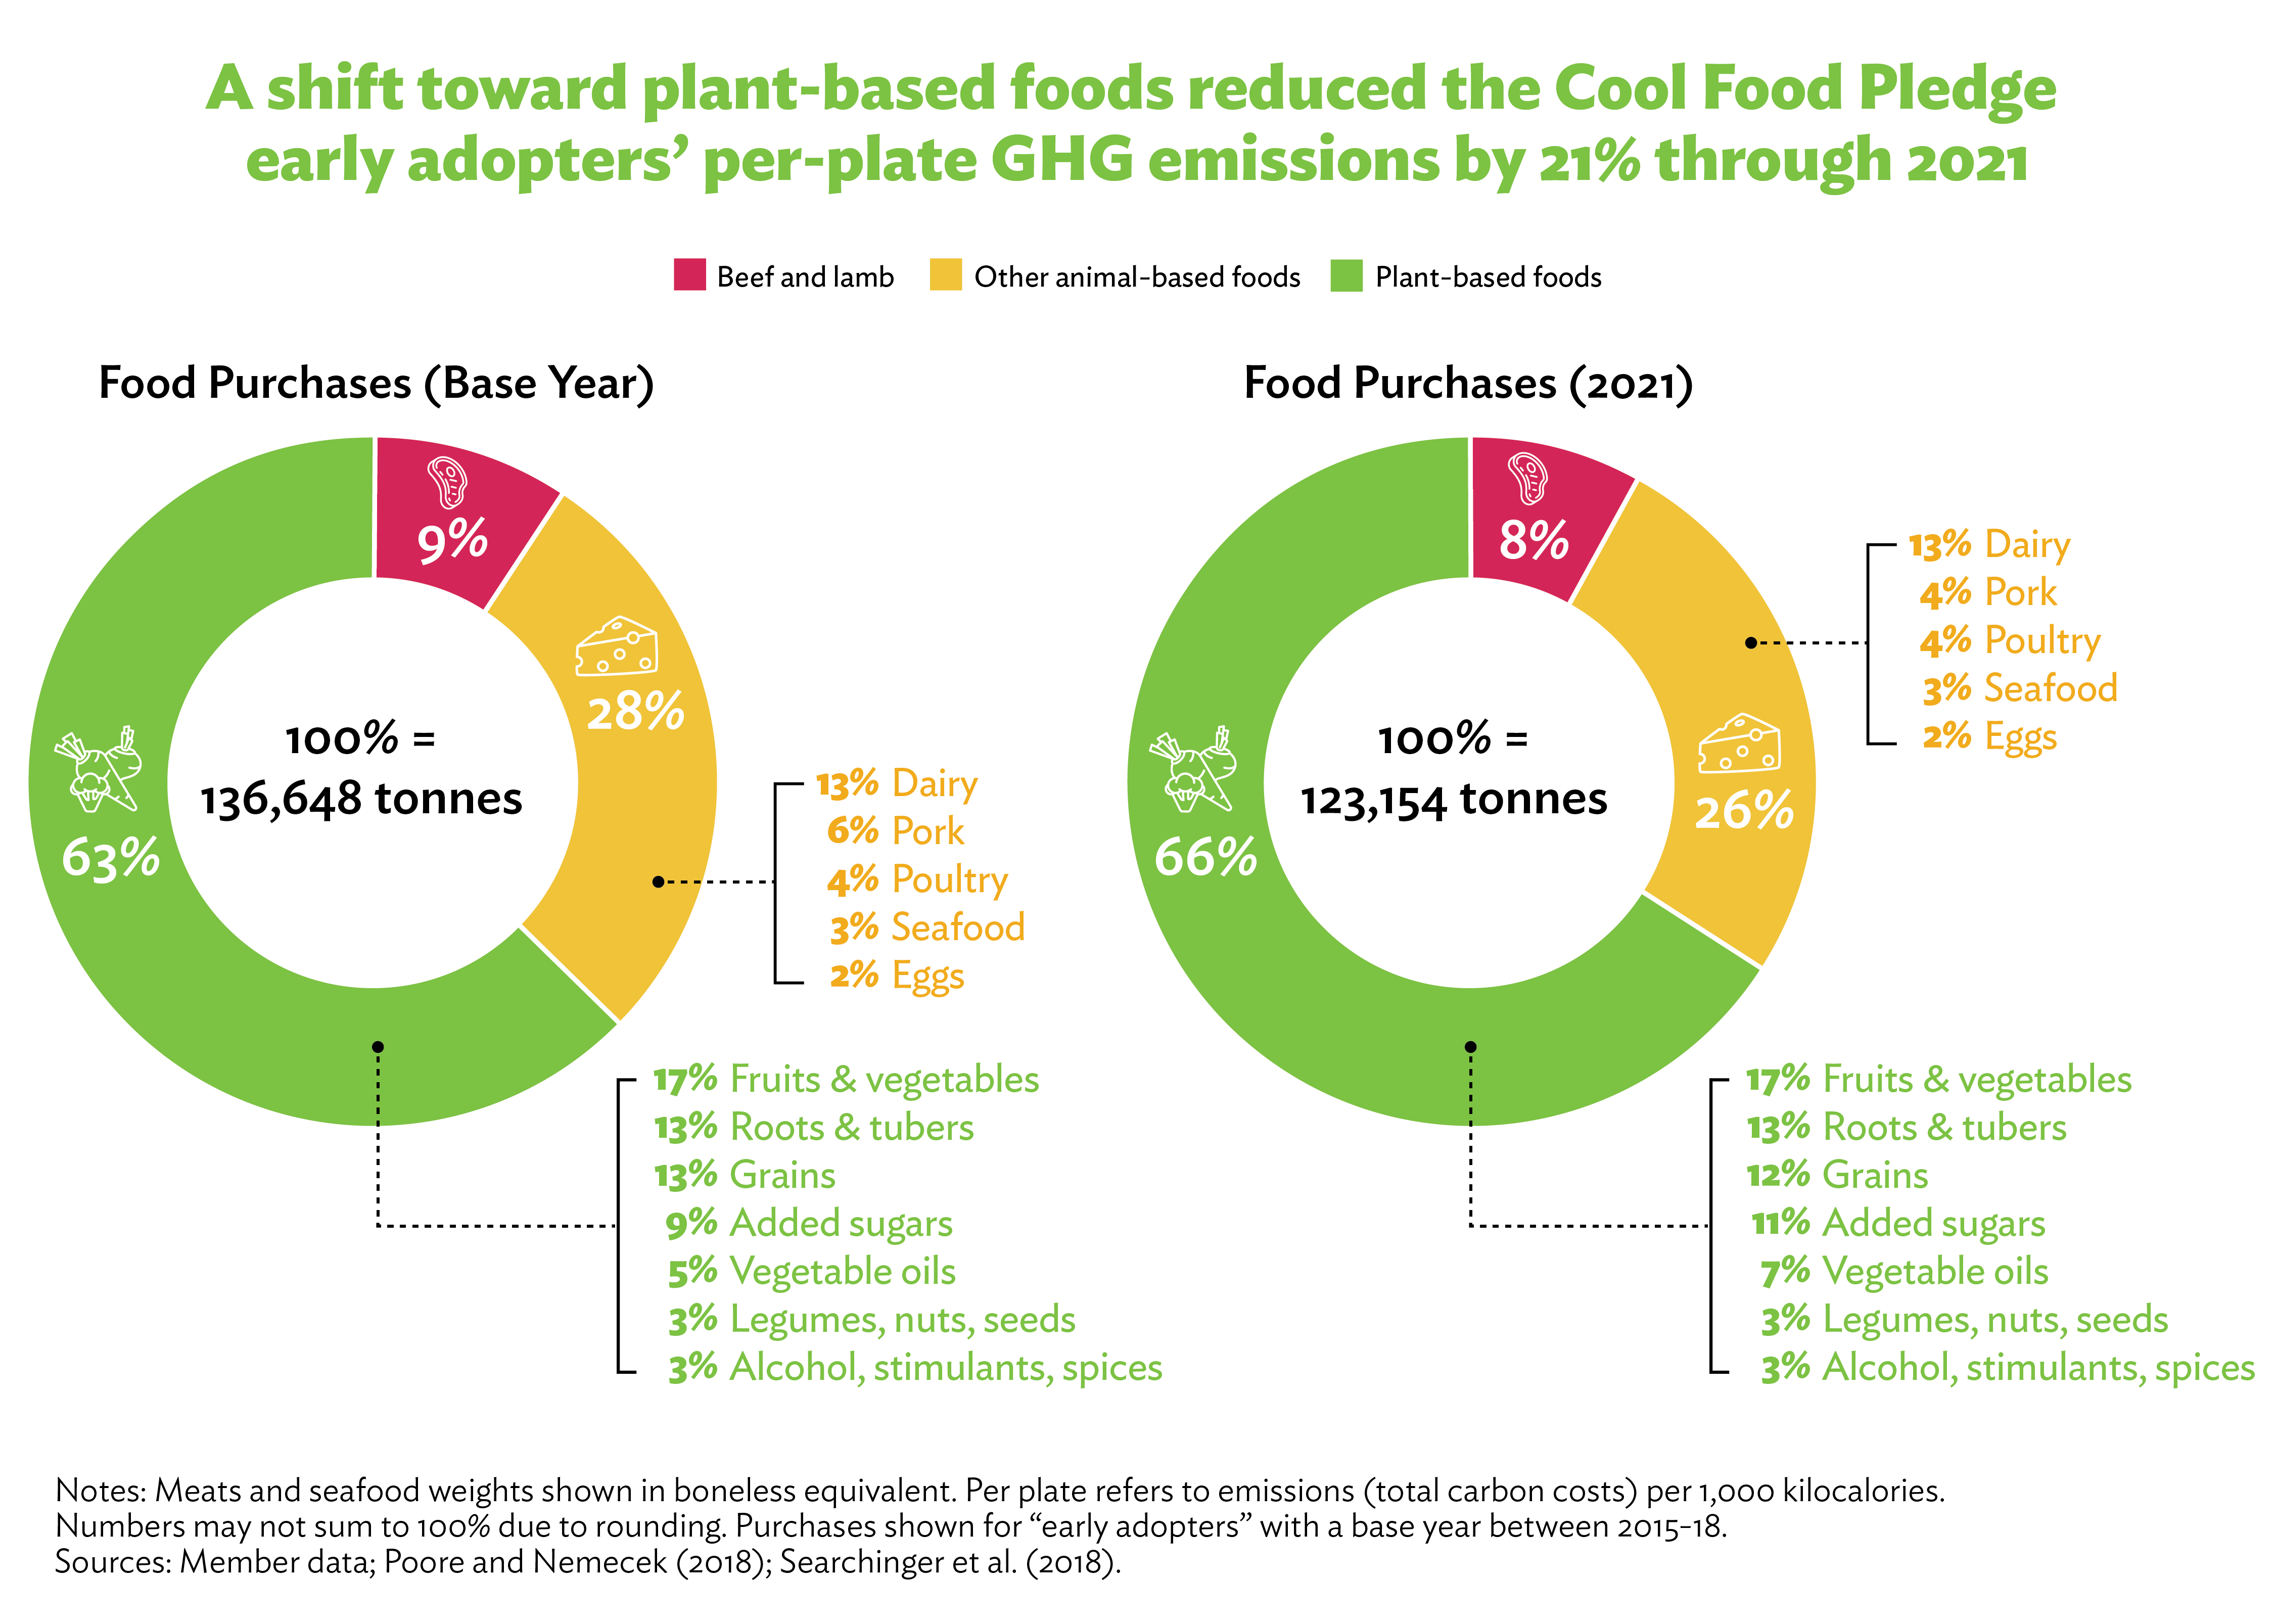
During 2021, the group’s purchasing continued to shift toward plants. Between the base year and 2021, the share of beef and lamb purchases by weight decreased from 9 to 8 percent, purchases of other animal-based foods decreased from 28 to 26 percent, and purchases of plant-based foods increased from 63 to 66 percent. Overall, this shift led to a 21 percent decline in food-related emissions (carbon costs) per plate. This per-plate metric is especially meaningful when analyzing 2021 performance because of the fluctuations in food purchasing during that year due to COVID-19. The 21 percent decline per plate is also encouraging because the group continues to remain ahead of the pace needed to hit Coolfood’s sub-target of a 38 percent decline in emissions per plate by 2030.[5]

Total (absolute) emissions from the early adopters’ food purchases fell by 23 percent through 2021, driven by a 10 percent decline in food purchases relative to the base year and a 19 percent decline in purchases of animal-based foods. We estimated the cohort’s total food-related carbon costs in 2021 at 3,340,823 tonnes of carbon dioxide equivalent (tCO2e), including 647,203 tCO2e from agricultural supply chain emissions and 2,693,620 tCO2e from annualized carbon opportunity costs.[6] Animal-based foods accounted for 86 percent of the early adopters’ total GHG emissions profile in 2021—with beef and lamb alone accounting for 66 percent—and plant-based foods accounted for 14 percent of the emissions profile.
Recent Adopters: Large Growth in the Coolfood Movement, Now Need to Accelerate Action
The recent adopters’ group is larger than the early cohort, with food-related GHG emissions (carbon costs) of 21,441,827 tCO2e in their base year. This new cohort brings the entire Coolfood Pledge group’s base year food-related emissions (carbon costs) to 25,776,814 tCO2e, meaning that if the full group can hit the 2030 absolute target, it would reduce annual emissions by more than 6,400,000 tCO2e versus the base year. This level of annual emissions reduction is equivalent to avoiding the annual tailpipe emissions from more than 1.3 million U.S. passenger vehicles—or all of the registered vehicles in Chicago, Illinois[7]—or more than 4.2 million EU passenger cars.[8]
Although the emissions reduction potential is large, the recent adopters’ group has had less time to implement changes to its food offerings. The cohort’s absolute food-related GHG emissions dropped by 39 percent between 2019 and 2021, but this was due to a large decrease in food purchasing linked to COVID-19. This recent cohort actually had an increase in its per-plate GHG emissions of 6 percent between 2019 and 2021, meaning the cohort needs to urgently begin to reduce its per-plate emissions by shifting toward plant-based foods to get on track for reaching the 2030 target.
Although it often takes organizations two to three years to start seeing significant decreases in their emissions, this can be faster with strong leadership. For example, in this recent cohort group, New York City—home to the largest public school system in the United States—reduced emissions by 37 percent per plate served in schools and other public facilities between 2019 and 2020.
Time to Step Up: 2030 Is Close
The early adopter group is on a very encouraging track, and Coolfood members are showing that big change is possible in a short time. It is exciting that the size of the Coolfood movement more than doubled in the past year, and we look forward to continuing to grow the movement while accelerating action across the whole membership. We will provide a progress update, using the group’s 2022 food purchase data, when new data are available.
Learn More
- More on methods and data sources: Coolfood Pledge technical note
- Broader Coolfood updates: FY22 Coolfood Progress Report
- Previous GHG estimates and updates:
[1] This report was prepared by Richard Waite, Clara Cho, and Jessica Zionts. Thanks to Anne Bordier, Emily Cassidy, Jillian Holzer, Edwina Hughes, and Gregory Taff for their helpful reviews, and to Caroline Taylor for copyediting.
[2] Food-related emissions “per plate” are calculated as food-related emissions per 1,000 kilocalories.
[3] As detailed further in the Coolfood Pledge technical note, global food demand (measured in crop calories) is projected to grow by 21 percent between 2015 and 2030. Reducing absolute food-related emissions by 25 percent while accommodating a 21 percent growth in food demand implies a necessary reduction in emissions per calorie of 38 percent during that period.
[4] We did not receive 2021 food purchase data from 10 members who had previously submitted data, and in these cases we held their food purchase and GHG emissions estimates flat between their most recent data year and 2021 to obtain the group 2021 estimate.
[5] A 38 percent decline by 2030, relative to 2015, would imply a 15.2 percent decline would be needed by 2021 assuming linear progress (38 / 15 * 6 = 15.2).
[6] “Agricultural supply chain emissions” include emissions associated with production of food and animal feed, as well as food transport, processing, packaging, and food losses prior to the point of purchase (Poore and Nemecek 2018). “Carbon opportunity costs” are total historical carbon losses from plants and soils on agricultural lands (this quantity also represents the amount of carbon that could be stored if land in agricultural production were allowed to return to native vegetation), and are annualized as in Searchinger et al. (2018).
[7] Illinois Secretary of State (2022).
[8] For U.S. passenger vehicles, the equivalency is taken from the U.S. Environmental Protection Agency’s GHG Equivalency Calculator (EPA 2022) and is calculated using data from the United States in 2019. Passenger vehicles include passenger cars, vans, pickup trucks, and sport utility vehicles, and tailpipe emissions averaged 4.64 tCO2e per vehicle per year. For passenger cars in Europe, data from EEA (2020) and Helmers et al. (2019) suggest that the average tailpipe emissions of European cars in 2018 were 1.51 tCO2e per vehicle per year (120.8 gCO2/km * 12,500 km = 1.51 tCO2e).
