Coolfood Pledge: Collective Member Progress through 2022
More than 60 food service providers have committed to Coolfood’s science-based target—known as the Coolfood Pledge—to reduce food-related emissions by 25 percent by 2030. If all members reduce absolute emissions by 25 percent by 2030, their reduced annual emissions would be equivalent to taking approximately 3.5 million cars off the road.[1]
Each year, Coolfood measures collective member progress toward the 2030 target using procurement data. It also provides cutting-edge behavioral science strategies that food service organizations can put into action to shift demand toward plant-based foods and achieve greenhouse gas (GHG) emissions reductions. This report presents Coolfood Pledge members’ progress through 2022.[2]
After analyzing the data, we find that cities, healthcare facilities, and universities are making significant progress toward the 2030 target, setting an example for what can be achieved and how to do it. However, the Coolfood Pledge membership overall is not yet on pace to meet the target. With just six years until 2030, members across the board must accelerate their shift toward low-carbon, plant-based foods.
Although some sectors are progressing faster than others, all have reduced per-plate emissions
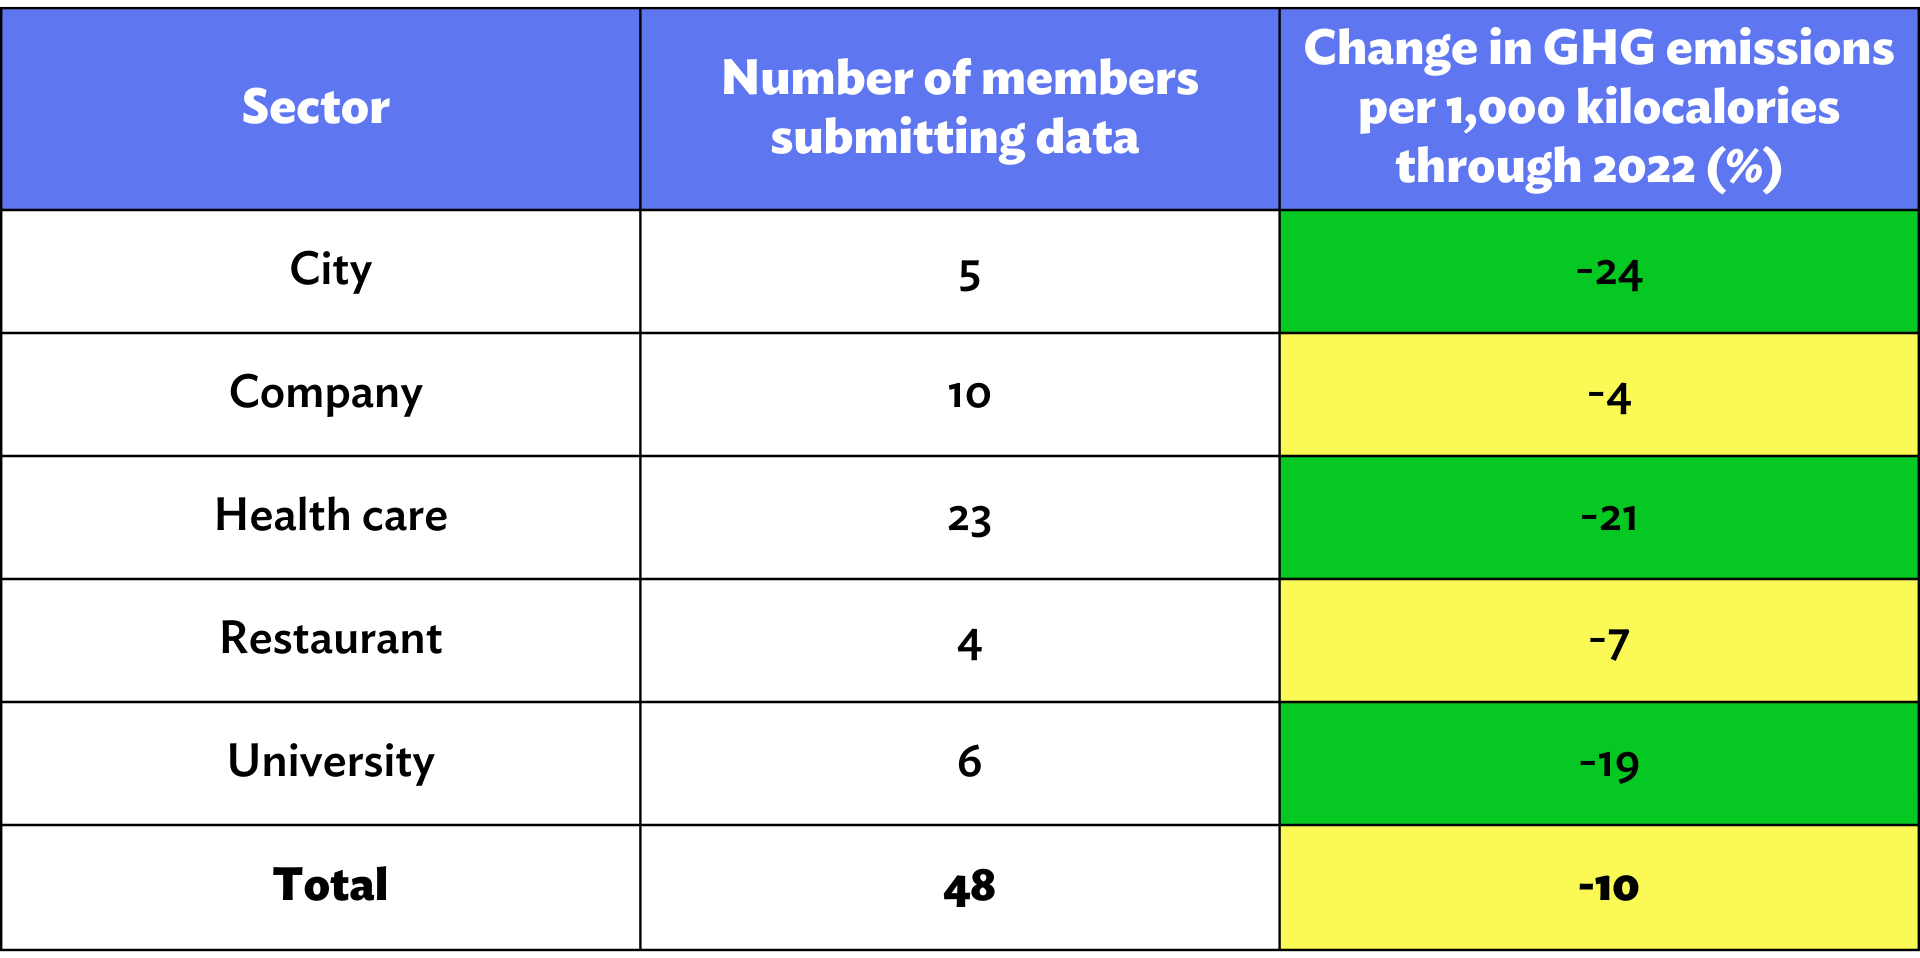
This year, for the first time, we analyzed sector-level progress toward the 2030 target (Table 1). The sector-level data reflect what our 48 members who joined prior to 2022 have achieved. Collectively, they serve more than 1 billion meals every year. Table 1 excludes members who joined the Coolfood Pledge in 2022–23 because they have not had sufficient time to implement changes that can be reflected in data through 2022.
The COVID-19 pandemic has caused ongoing fluctuations to food purchases since 2020, so this report also includes the group’s estimated reduction of GHG emissions “per plate” through 2022.[3] The Coolfood Pledge includes a sub-target of a 38 percent reduction in emissions per plate by 2030.[4]

Sources: Member data; Poore and Nemecek (2018) (agricultural supply chain emissions); Searchinger et al. (2018) (carbon opportunity costs).
All sectors—including cities, companies, healthcare facilities, restaurants, and universities—are moving in the right direction by reducing their “per-plate” GHG emissions, with the total cohort achieving an overall 10 percent reduction in per-plate emissions.
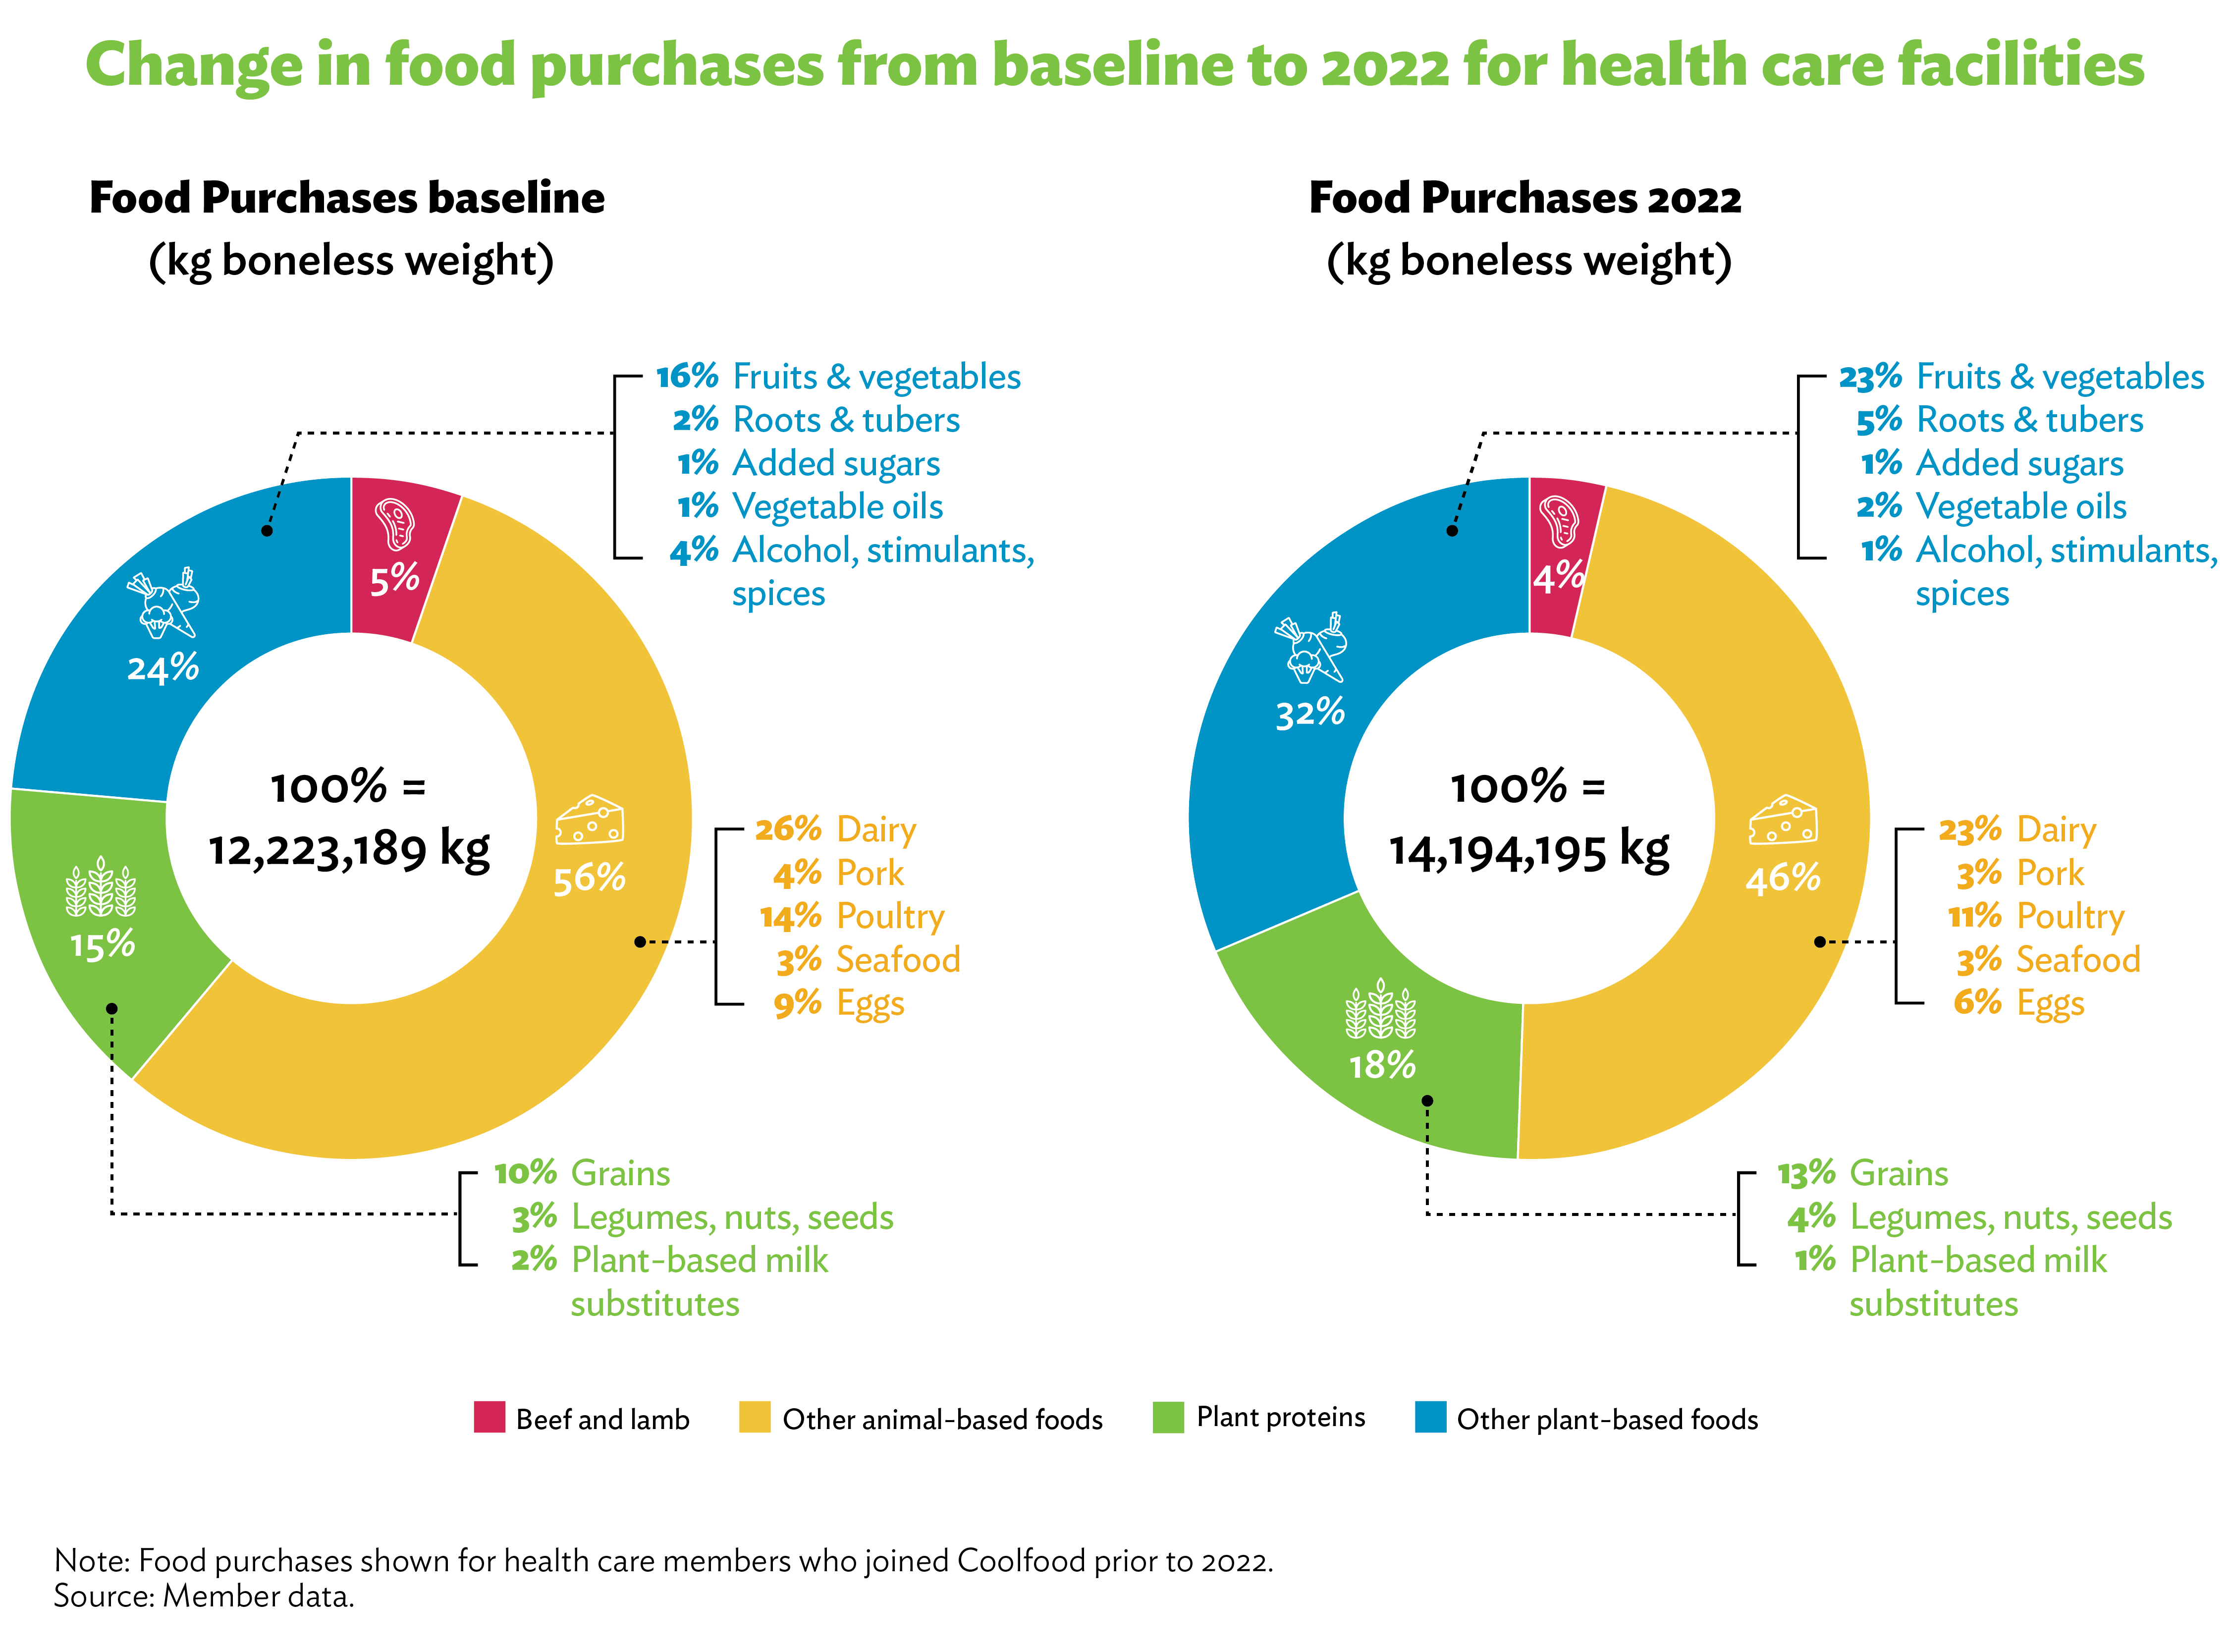
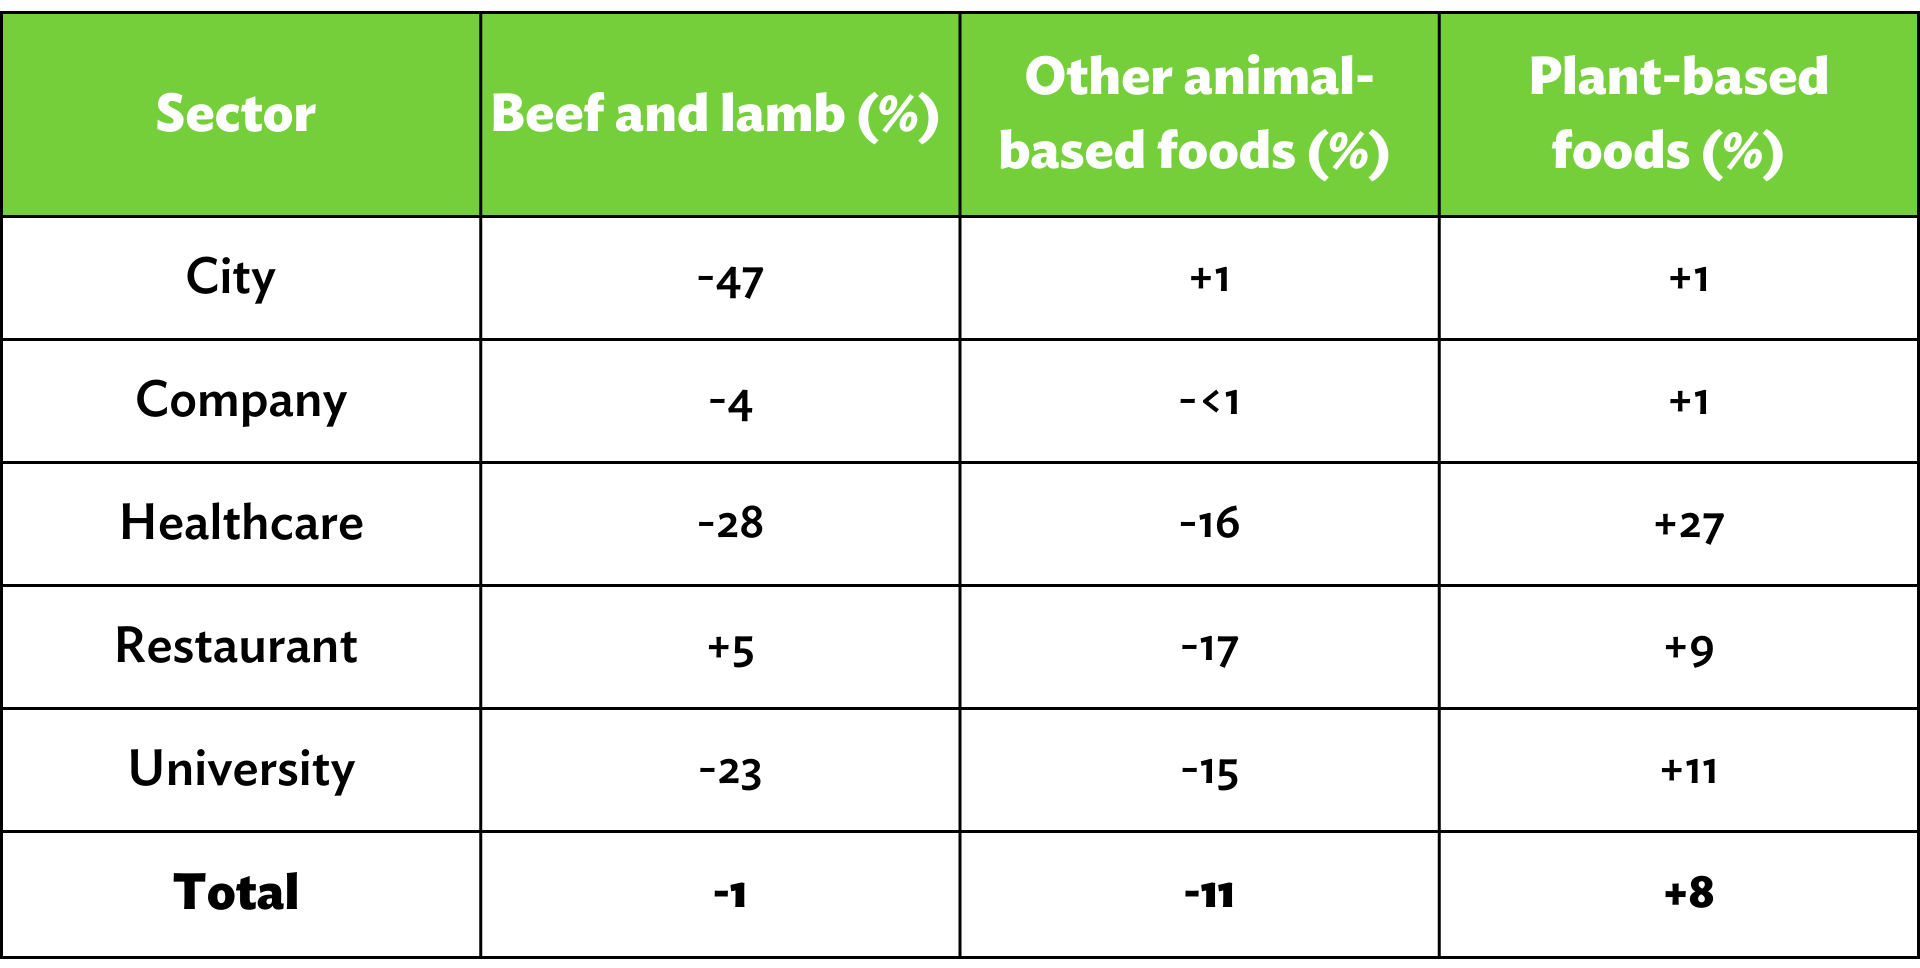
Cities, healthcare facilities, and universities stand out as being ahead of the pace needed for 2030, which is a 17.7 percent reduction in per-plate emissions through 2022.[5] This drop in emissions has largely resulted from a shift away from serving animal-based foods—especially beef and lamb—and toward serving more plant-based foods (Table 2). For example, at healthcare facilities, the share of beef and lamb on the plate has decreased by 28 percent, along with a 16 percent decrease in the share of other animal-based foods. At the same time, healthcare facilities have increased the share of plant-based foods on the average plate by 27 percent (Table 2). Together, these changes have led to an overall reduction in per-plate emissions of 21 percent (Table 1). Figure 1 below illustrates how the average plate served by healthcare facilities has shifted over time.
Figure 1: Change in food purchases from baseline to 2022 for healthcare facilities

Cities and universities have made similarly large changes to the food they serve and have seen similarly large drops in their per-plate GHG emissions. Overall, the university, city, and healthcare sectors demonstrate the types of changes that are possible to achieve with committed action, and they present a path forward for other food service sectors to follow. Restaurants and companies are also making progress—but not at the pace needed through 2022. This tells us that they will need to accelerate action going forward to hit the 2030 target.[6]

Source: Member data.
As purchases have rebounded, so have absolute emissions
Although looking at per-plate emissions shows encouraging progress over the past few difficult years for food service, it’s also important to consider total (absolute) emissions. Because the COVID-19 pandemic led many people to avoid eating outside their homes, Coolfood Pledge members’ food purchases were low in 2020 and 2021, which resulted in artificially large dips in their absolute food-related emissions. In 2022, we saw these numbers rebound as food purchases increased.
Overall, the group reduced absolute emissions by 5 percent between the base year and 2022.[7] This reduction was driven by a 2 percent decline in food purchases and an 11 percent decline in purchases of animal-based foods in 2022, relative to the base year. This 5 percent absolute emissions reduction is not on the pace needed for 2030; a reduction of 11.7 percent through 2022 was necessary to be on track.[8]
We estimate that the total food-related carbon costs of these members were 9,592,851 tonnes of carbon dioxide equivalent (tCO2e) in 2022, including 1,996,044 tCO2e from agricultural supply chains and 7,596,807 tCO2e from annualized carbon opportunity costs.[9] Among members who joined before 2022, animal-based foods accounted for 89 percent of their total food-based GHG emissions profile in 2022—with beef and lamb alone accounting for 63 percent—and plant-based foods accounted for 11 percent of the emissions profile (Figure 2).
Progress by Coolfood’s newest members
As of this writing, members who joined the Coolfood Pledge in 2022–23 have so far reduced their per-plate emissions by 3 percent. We estimate that the total food-related carbon costs of these members were 8,092,453 tCO2e in 2022, including 1,778,830 tCO2e from agricultural supply chains and 6,313,623 tCO2e from annualized carbon opportunity costs.
These newest members of the Coolfood Pledge serve 1.1 billion meals each year, roughly the same number of meals as members who joined pre-2022. However, unlike our earlier members, they have not yet had sufficient time to make significant progress. They will need to accelerate changes immediately as they work to reduce their per-plate emissions to get on track for 2030.
Action must accelerate to achieve the 2030 target
Coolfood Pledge members are true leaders in the movement to serve healthy, sustainable meals. They have taken a vital step by publicly committing to the Coolfood Pledge target and have already made some progress toward reducing emissions by 25 percent by 2030. Many more food service providers must join them.
With just six years until 2030, it’s critical that worldwide action accelerate toward this goal. Coolfood members should take the following steps:
- Use the analysis of their food procurement data and associated emissions, which is provided annually by Coolfood, as a guide for where they may further reduce their purchases of carbon-intensive foods and thereby emissions. With only a few years to go, setting precise annual goals based on performance to date and the 2030 target can help members to get on track.
- Tap behavioral science strategies known to help shift diners toward lower-carbon foods, as outlined in the Playbook for Guiding Diners toward Plant-Rich Dishes in Food Service by World Resources Institute (WRI). WRI will release the second edition of the Playbook in early 2024, with the latest no-regret strategies to employ.
- Win the hearts and minds of internal leaders, who are important for organizational success, as well as customers and diners. Coolfood offers tailored trainings for its members to help them better understand the right strategies for their circumstance and develop internal buy-in. The Coolfood Meals label is available to help food service engage with diners by making it easy to identify low-carbon menu items.
Learn More
More on methods and data sources: Coolfood Pledge technical note
Previous GHG estimates and updates:
[1] For passenger cars in Europe, data from the European Environmental Agency (2020) and Helmers et al. (2019) suggest that the average tailpipe emissions of European cars in 2018 were 1.51 tonnes of carbon dioxide equivalent (tCO2e) per vehicle per year (120.8 gCO2/km * 12,500 km = 1.51 tCO2e).
[2] This report was written by Clara Cho and Richard Waite. Thanks to Anne Bordier, Edwina Hughes, Gregory Taff, Jillian Holzer and Raychel Santo for their helpful reviews, and to Lauri Scherer for copyediting.
[3] Food-related emissions “per plate” are calculated as food-related emissions per 1,000 kilocalories.
[4] As detailed further in the Coolfood Pledge technical note, global food demand (measured in crop calories) is projected to grow by 21 percent between 2015 and 2030. Reducing absolute food-related emissions by 25 percent while accommodating a 21 percent growth in food demand implies a necessary reduction in emissions per calorie of 38 percent during that period.
[5] A 38 percent decline by 2030, relative to 2015, would imply a 17.7 percent decline would be needed by 2022 assuming linear progress (38 / 15 * 7 = 17.7).
[6] For the data year 2021, we reported a 21 percent reduction in per-plate GHG emissions for the cohort of members with a baseline year between 2015 and 2018. This 2015–18 base year cohort is similar to, but not the same as, the one used in this report (i.e., the cohort members who joined before 2022). The smaller 10 percent reduction reported through 2022, relative to the reduction reported through 2021, is largely due to member updates of historical data.
[7] The base year for the Coolfood GHG reduction target is 2015, but food purchase data from as far back as 2015 were unavailable for most members. We therefore accepted baseline data for any year between 2015 and 2021 for the purposes of establishing a group baseline, as detailed in the Coolfood Pledge technical note.
[8] A 25 percent decline by 2030, relative to 2015, would imply that an 11.7 percent decline would be needed by 2022 assuming linear progress (25 / 15 * 7 = 11.7).
[9] Agricultural supply chain emissions include emissions associated with the production of food and animal feed as well as food transport, processing, packaging, and food losses prior to the point of purchase (Poore and Nemecek 2018). Carbon opportunity costs are the total historical carbon losses from plants and soils on agricultural lands (this quantity also represents the amount of carbon that could be stored if land in agricultural production were allowed to return to native vegetation) and are annualized as in Searchinger et al. (2018). Carbon opportunity costs are important to include because, as Coolfood members shift their purchases to less land-intensive foods, this metric tracks the climate benefits of using less agricultural land and reducing pressure on the world’s remaining natural ecosystems.
